GUINNESS PEAT GROUP PLC • ANNUAL REPORT • 5337. Derivatives and Other Financial Instruments - continuedInvestments are held for strategic growth or trading purposes.Market values have been used to derive the fair value of all listedinvestments, the CLNs and the Capital Notes. Unlisted investments are valued according to the most recent price at which theyhave been traded.For floating rate financial assets and liabilities, and for fixed rate financial assets and liabilities with a maturityof less than six months, it has been assumed that fair values are approximately the same as book values. Fair values for forwardforeign currency contracts have been estimated using applicable forward exchange rates at the year end.The fair values of theequity options, equity swaps and the cross-currency interest rate swap have been determined by third party institutions, basedon market rates. All other fair values have been calculated by discounting expected cash flows at prevailing interest rates.Gains and losses on forward foreign currency contracts used for hedging future transactions are not recognised until the exposureto which they relate is itself recognised.Such gains and losses are incorporated in the value of the transaction being hedged.CURRENCY EXPOSUREThe table below shows the extent to which <strong>Group</strong> companies have monetary assets and liabilities in currencies other than theirlocal currency after taking account of forward foreign currency contracts and cross-currency interest rate swaps held as hedges.Foreign exchange differences arising on retranslation of these assets and liabilities are taken to the <strong>Group</strong>’s profit and loss account.The table excludes loans between <strong>Group</strong> companies that form part of the net investment in overseas subsidiaries on which theexchange differences are dealt with through reserves. It also excludes investments held in equity shares, which are translated intothe investing company’s reporting currency at the historical rate on the date of acquisition and are not subsequently re-translated.Net foreign currency monetary assets/(liabilities)Australian New ZealandFunctional currency Sterling dollars dollars US dollars Other Total<strong>2003</strong> £000 £000 £000 £000 £000 £000Sterling – 98,412 (91,068) 18,500 (19,250) 6,594US dollars – – – – 290 290Australian dollars – – – (427) (15) (442)New Zealand dollars (62) 872 – 1,577 106 2,493(62) 99,284 (91,068) 19,650 (18,869) 8,935Net foreign currency monetary assets/(liabilities)Australian New ZealandFunctional currency Sterling dollars dollars US dollars Other Total2002 £000 £000 £000 £000 £000 £000Sterling – 72,962 13,907 (3,206) (11,384) 72,279US dollars – – – – 612 612New Zealand dollars 40 54 – 275 1,594 1,96340 73,016 13,907 (2,931) (9,178) 74,854
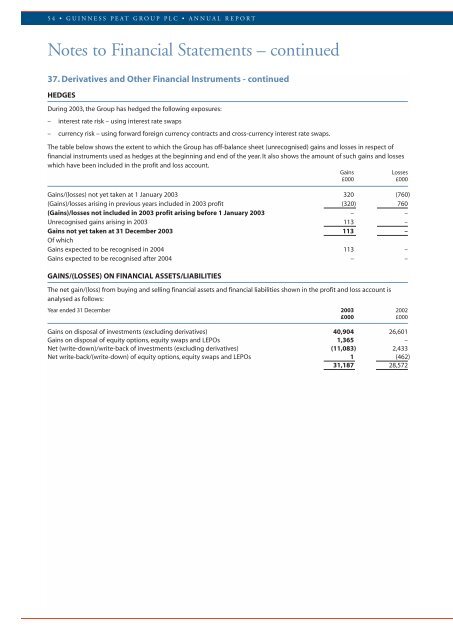
54 • GUINNESS PEAT GROUP PLC • ANNUAL REPORTNotes to Financial Statements – continued37. Derivatives and Other Financial Instruments - continuedHEDGESDuring <strong>2003</strong>, the <strong>Group</strong> has hedged the following exposures:– interest rate risk – using interest rate swaps– currency risk – using forward foreign currency contracts and cross-currency interest rate swaps.The table below shows the extent to which the <strong>Group</strong> has off-balance sheet (unrecognised) gains and losses in respect offinancial instruments used as hedges at the beginning and end of the year. It also shows the amount of such gains and losseswhich have been included in the profit and loss account.GainsLosses£000 £000Gains/(losses) not yet taken at 1 January <strong>2003</strong> 320 (760)(Gains)/losses arising in previous years included in <strong>2003</strong> profit (320) 760(Gains)/losses not included in <strong>2003</strong> profit arising before 1 January <strong>2003</strong> – –Unrecognised gains arising in <strong>2003</strong> 113 –Gains not yet taken at 31 December <strong>2003</strong> 113 –Of whichGains expected to be recognised in 2004 113 –Gains expected to be recognised after 2004 – –GAINS/(LOSSES) ON FINANCIAL ASSETS/LIABILITIESThe net gain/(loss) from buying and selling financial assets and financial liabilities shown in the profit and loss account isanalysed as follows:Year ended 31 December <strong>2003</strong> 2002£000 £000Gains on disposal of investments (excluding derivatives) 40,904 26,601Gains on disposal of equity options, equity swaps and LEPOs 1,365 –Net (write-down)/write-back of investments (excluding derivatives) (11,083) 2,433Net write-back/(write-down) of equity options, equity swaps and LEPOs 1 (462)31,187 28,572