CONTENTS
Contents of 41(2) 2013 - acharya ng ranga agricultural university
Contents of 41(2) 2013 - acharya ng ranga agricultural university
- No tags were found...

Create successful ePaper yourself
Turn your PDF publications into a flip-book with our unique Google optimized e-Paper software.
NUTRIENT UPTAKE OF MICROSPRINKLER IRRIGATED WHEAT CULTIVARS<br />
reported by Mukherjee (2008) and Singh et al. (2010)<br />
owing to their genetic makeup and yield potential.<br />
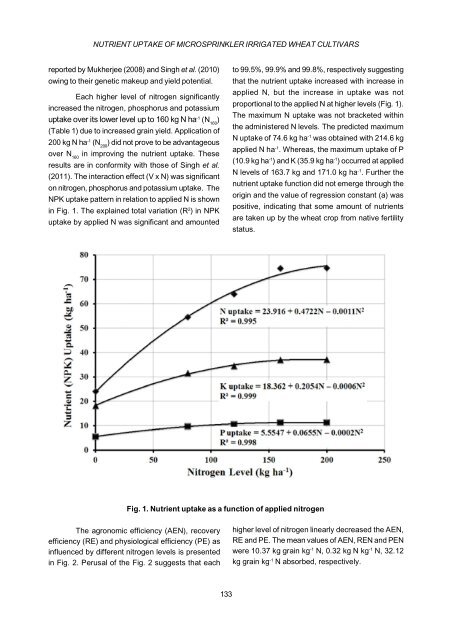
Each higher level of nitrogen significantly<br />
increased the nitrogen, phosphorus and potassium<br />
uptake over its lower level up to 160 kg N ha -1 (N 160<br />
)<br />
(Table 1) due to increased grain yield. Application of<br />
200 kg N ha -1 (N 200<br />
) did not prove to be advantageous<br />
over N 160<br />
in improving the nutrient uptake. These<br />
results are in conformity with those of Singh et al.<br />
(2011). The interaction effect (V x N) was significant<br />
on nitrogen, phosphorus and potassium uptake. The<br />
NPK uptake pattern in relation to applied N is shown<br />
in Fig. 1. The explained total variation (R 2 ) in NPK<br />
uptake by applied N was significant and amounted<br />
to 99.5%, 99.9% and 99.8%, respectively suggesting<br />
that the nutrient uptake increased with increase in<br />
applied N, but the increase in uptake was not<br />
proportional to the applied N at higher levels (Fig. 1).<br />
The maximum N uptake was not bracketed within<br />
the administered N levels. The predicted maximum<br />
N uptake of 74.6 kg ha -1 was obtained with 214.6 kg<br />
applied N ha -1 . Whereas, the maximum uptake of P<br />
(10.9 kg ha -1 ) and K (35.9 kg ha -1 ) occurred at applied<br />
N levels of 163.7 kg and 171.0 kg ha -1 . Further the<br />
nutrient uptake function did not emerge through the<br />
origin and the value of regression constant (a) was<br />
positive, indicating that some amount of nutrients<br />
are taken up by the wheat crop from native fertility<br />
status.<br />
Fig. 1. Nutrient uptake as a function of applied nitrogen<br />
The agronomic efficiency (AEN), recovery<br />
efficiency (RE) and physiological efficiency (PE) as<br />
influenced by different nitrogen levels is presented<br />
in Fig. 2. Perusal of the Fig. 2 suggests that each<br />
higher level of nitrogen linearly decreased the AEN,<br />
RE and PE. The mean values of AEN, REN and PEN<br />
were 10.37 kg grain kg -1 N, 0.32 kg N kg -1 N, 32.12<br />
kg grain kg -1 N absorbed, respectively.<br />
133