Table B–2. Gross domestic product, 2000–2015—Continued [Quarterly data at seasonally adjusted annual rates] Year or quarter Net exports of goods and services Net exports Exports Imports Total Government consumption expenditures and gross investment Total Federal National defense Nondefense State and local Billions of dollars Final sales of domestic product Gross domestic purchases 1 Final sales to private domestic purchasers 2 Gross domestic income (GDI) 3 Average of GDP and GDI 2000 –375.8 1,096.8 1,472.6 1,834.4 632.4 391.7 240.7 1,202.0 10,230.2 10,660.6 8,771.6 10,384.3 10,334.5 2001 –368.7 1,026.7 1,395.4 1,958.8 669.2 412.7 256.5 1,289.5 10,660.1 10,990.5 9,070.0 10,736.8 10,679.3 2002 –426.5 1,002.5 1,429.0 2,094.9 740.6 456.8 283.8 1,354.3 10,959.0 11,404.0 9,290.5 11,050.3 11,013.9 2003 –503.7 1,040.3 1,543.9 2,220.8 824.8 519.9 304.9 1,396.0 11,491.4 12,014.3 9,774.2 11,524.3 11,517.5 2004 –619.2 1,181.5 1,800.7 2,357.4 892.4 570.2 322.1 1,465.0 12,211.1 12,894.1 10,472.8 12,283.5 12,279.2 2005 –721.2 1,308.9 2,030.1 2,493.7 946.3 608.3 338.1 1,547.4 13,034.1 13,814.9 11,261.6 13,129.2 13,111.5 2006 –770.9 1,476.3 2,247.3 2,642.2 1,002.0 642.4 359.6 1,640.2 13,788.9 14,626.8 11,917.7 14,073.2 13,964.5 2007 –718.5 1,664.6 2,383.2 2,801.9 1,049.8 678.7 371.0 1,752.2 14,443.2 15,196.2 12,359.8 14,460.1 14,468.9 2008 –723.1 1,841.9 2,565.0 3,003.2 1,155.6 754.1 401.5 1,847.6 14,750.6 15,441.6 12,470.5 14,619.2 14,668.9 2009 –395.4 1,587.7 1,983.2 3,089.1 1,217.7 788.3 429.4 1,871.4 14,566.3 14,814.2 11,872.7 14,343.4 14,381.1 2010 –512.7 1,852.3 2,365.0 3,174.0 1,303.9 832.8 471.1 1,870.2 14,902.8 15,477.0 12,241.5 14,915.2 14,939.8 2011 –580.0 2,106.4 2,686.4 3,168.7 1,303.5 836.9 466.5 1,865.3 15,476.2 16,097.9 12,887.4 15,556.3 15,537.1 2012 –565.7 2,198.2 2,763.8 3,158.6 1,292.5 817.8 474.7 1,866.1 16,093.5 16,720.9 13,500.5 16,358.5 16,256.9 2013 –508.4 2,263.3 2,771.7 3,114.2 1,230.6 767.7 463.0 1,883.6 16,591.4 17,171.6 13,985.5 16,840.8 16,752.0 2014 –530.0 2,341.9 2,871.9 3,152.1 1,219.9 748.2 471.6 1,932.3 17,270.9 17,878.1 14,648.8 17,560.1 17,454.1 2015 p –531.9 2,253.0 2,784.9 3,184.0 1,224.7 740.9 483.9 1,959.3 17,831.4 18,469.8 15,179.2 2012: I –614.7 2,169.6 2,784.3 3,171.6 1,300.5 826.4 474.1 1,871.0 15,908.4 16,588.6 13,351.6 16,192.6 16,083.2 II –580.9 2,199.8 2,780.7 3,159.6 1,293.7 818.8 474.9 1,865.9 16,032.6 16,702.8 13,453.9 16,290.2 16,206.0 III –535.2 2,209.4 2,744.5 3,159.6 1,297.0 821.5 475.5 1,862.6 16,153.9 16,763.1 13,529.5 16,371.8 16,299.8 IV –531.8 2,214.0 2,745.8 3,143.5 1,278.9 804.6 474.3 1,864.6 16,278.9 16,829.2 13,667.3 16,579.5 16,438.4 2013: I –529.2 2,226.6 2,755.8 3,119.8 1,250.4 783.8 466.6 1,869.4 16,404.2 16,969.9 13,813.6 16,626.2 16,533.4 II –527.8 2,237.6 2,765.4 3,111.4 1,234.2 772.3 461.9 1,877.2 16,478.1 17,054.6 13,894.5 16,787.2 16,657.0 III –512.4 2,264.3 2,776.7 3,110.7 1,220.4 759.2 461.1 1,890.3 16,621.9 17,239.9 14,023.6 16,882.6 16,805.0 IV –464.3 2,324.5 2,788.8 3,115.1 1,217.6 755.4 462.2 1,897.5 16,861.2 17,421.9 14,210.4 17,067.2 17,012.4 2014: I –529.4 2,301.5 2,830.8 3,122.3 1,214.8 746.8 468.0 1,907.5 16,941.6 17,513.7 14,348.7 17,159.6 17,072.0 II –530.9 2,356.2 2,887.0 3,146.3 1,216.9 748.4 468.4 1,929.4 17,181.0 17,800.9 14,565.7 17,457.0 17,363.5 III –514.6 2,360.6 2,875.2 3,177.4 1,233.1 759.5 473.6 1,944.3 17,433.8 18,036.6 14,770.9 17,746.1 17,634.1 IV –545.2 2,349.5 2,894.6 3,162.5 1,214.7 738.2 476.5 1,947.8 17,527.4 18,161.1 14,910.1 17,877.8 17,746.8 2015: I –551.6 2,257.3 2,808.9 3,149.5 1,218.2 739.0 479.2 1,931.3 17,522.0 18,200.9 14,924.1 17,901.6 17,775.4 II –519.3 2,280.0 2,799.3 3,179.2 1,220.7 740.1 480.6 1,958.4 17,786.2 18,433.0 15,126.3 18,094.0 18,003.9 III –530.4 2,259.8 2,790.2 3,201.0 1,224.3 738.2 486.1 1,976.6 17,964.9 18,590.6 15,294.3 18,272.1 18,166.1 IV p –526.4 2,214.7 2,741.1 3,206.5 1,235.6 746.1 489.5 1,970.9 18,052.4 18,654.7 15,372.3 Billions of chained (2009) dollars 2000 –477.8 1,258.4 1,736.2 2,498.2 817.7 512.3 305.4 1,689.1 12,494.9 13,057.9 10,494.9 12,681.2 12,620.4 2001 –502.1 1,184.9 1,687.0 2,592.4 849.8 530.0 319.7 1,751.5 12,729.6 13,208.5 10,669.0 12,819.5 12,750.9 2002 –584.3 1,164.5 1,748.8 2,705.8 910.8 567.3 343.3 1,802.4 12,888.9 13,518.4 10,805.0 12,994.4 12,951.5 2003 –641.9 1,185.0 1,826.9 2,764.3 973.0 615.4 357.5 1,795.3 13,249.0 13,938.5 11,162.3 13,286.8 13,278.9 2004 –734.8 1,300.6 2,035.3 2,808.2 1,017.1 652.7 364.5 1,792.8 13,702.2 14,531.7 11,657.9 13,783.1 13,778.3 2005 –782.3 1,381.9 2,164.2 2,826.2 1,034.8 665.5 369.4 1,792.3 14,168.8 15,040.3 12,149.9 14,272.7 14,253.5 2006 –794.3 1,506.8 2,301.0 2,869.3 1,060.9 678.8 382.1 1,808.8 14,542.3 15,431.6 12,490.8 14,842.9 14,728.4 2007 –712.6 1,646.4 2,359.0 2,914.4 1,078.7 695.6 383.1 1,836.1 14,836.2 15,606.8 12,655.0 14,855.8 14,864.8 2008 –557.8 1,740.8 2,298.6 2,994.8 1,152.3 748.1 404.2 1,842.4 14,865.7 15,399.9 12,441.1 14,730.2 14,780.3 2009 –395.4 1,587.7 1,983.2 3,089.1 1,217.7 788.3 429.4 1,871.4 14,566.3 14,814.2 11,872.7 14,343.4 14,381.1 2010 –458.8 1,776.6 2,235.4 3,091.4 1,270.7 813.5 457.1 1,820.8 14,722.2 15,244.9 12,092.5 14,735.2 14,759.5 2011 –459.4 1,898.3 2,357.7 2,997.4 1,236.4 795.0 441.4 1,761.0 14,979.0 15,483.9 12,448.1 15,057.7 15,039.1 2012 –447.1 1,963.2 2,410.2 2,941.6 1,213.5 768.2 445.3 1,728.1 15,292.3 15,804.3 12,806.0 15,547.8 15,451.2 2013 –417.5 2,018.1 2,435.6 2,854.9 1,144.1 716.6 427.5 1,710.2 15,511.4 16,001.4 13,082.6 15,749.5 15,666.4 2014 –442.5 2,086.4 2,528.9 2,838.3 1,116.3 689.1 427.0 1,720.8 15,881.7 16,405.8 13,497.7 16,156.8 16,059.2 2015 p –547.1 2,109.5 2,656.5 2,859.9 1,113.5 681.0 432.2 1,745.0 16,237.2 16,891.1 13,938.4 2012: I –462.7 1,942.6 2,405.3 2,963.7 1,223.9 777.9 446.0 1,739.8 15,225.0 15,757.6 12,732.9 15,500.4 15,395.7 II –452.7 1,964.4 2,417.0 2,949.4 1,214.8 769.2 445.6 1,734.5 15,276.9 15,818.1 12,788.7 15,522.8 15,442.6 III –446.8 1,974.1 2,420.9 2,940.9 1,216.2 770.8 445.4 1,724.7 15,302.7 15,830.2 12,816.9 15,517.1 15,449.0 IV –426.0 1,971.7 2,397.8 2,912.3 1,199.0 754.7 444.2 1,713.3 15,364.6 15,811.3 12,885.5 15,650.6 15,517.4 2013: I –425.9 1,976.6 2,402.6 2,878.8 1,170.1 734.4 435.6 1,708.5 15,424.7 15,883.9 12,979.6 15,631.6 15,544.4 II –434.2 2,000.5 2,434.7 2,864.1 1,153.2 723.6 429.5 1,710.4 15,451.9 15,935.9 13,031.1 15,744.4 15,622.3 III –428.3 2,021.1 2,449.4 2,848.1 1,136.3 709.4 426.7 1,711.1 15,508.9 16,043.9 13,098.5 15,759.2 15,686.8 IV –381.5 2,074.2 2,455.7 2,828.5 1,116.9 698.8 418.0 1,710.6 15,660.0 16,141.9 13,221.2 15,863.4 15,812.5 2014: I –434.0 2,038.7 2,472.7 2,828.4 1,117.8 690.6 427.0 1,709.6 15,675.7 16,160.3 13,292.0 15,887.3 15,806.1 II –443.3 2,086.8 2,530.1 2,836.5 1,114.5 689.8 424.6 1,720.8 15,809.7 16,346.6 13,428.3 16,073.6 15,987.5 III –429.1 2,096.0 2,525.1 2,849.2 1,124.7 697.3 427.1 1,723.5 15,978.6 16,498.9 13,569.8 16,274.3 16,171.6 IV –463.6 2,123.9 2,587.5 2,839.0 1,108.3 678.6 429.4 1,729.3 16,062.9 16,617.2 13,700.8 16,391.5 16,271.5 2015: I –541.2 2,091.4 2,632.5 2,838.5 1,111.3 680.3 430.7 1,725.9 16,053.8 16,720.8 13,770.1 16,408.6 16,293.0 II –534.6 2,117.5 2,652.1 2,856.9 1,111.3 680.8 430.2 1,744.1 16,209.7 16,870.7 13,901.6 16,498.0 16,415.8 III –546.1 2,121.1 2,667.2 2,869.7 1,112.0 678.4 433.2 1,756.2 16,319.3 16,962.4 14,010.1 16,606.6 16,510.3 IV p –566.5 2,107.8 2,674.3 2,874.5 1,119.4 684.4 434.7 1,753.6 16,366.0 17,010.4 14,071.9 1 Gross domestic product (GDP) less exports of goods and services plus imports of goods and services. 2 Personal consumption expenditures plus gross private fixed investment. 3 For chained dollar measures, gross domestic income is deflated by the implicit price deflator for GDP. Source: Department of Commerce (Bureau of Economic Analysis). GDP, Income, Prices, and Selected Indicators | 403
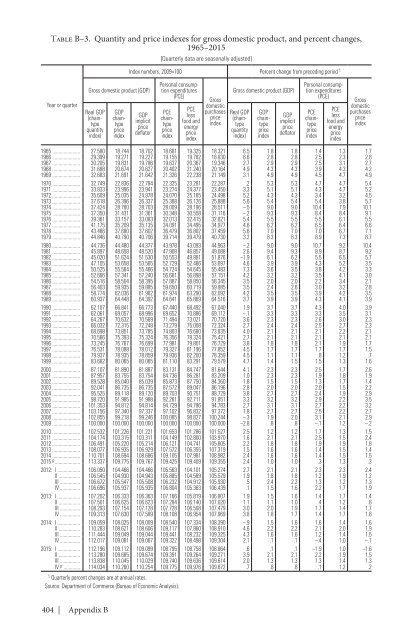
Table B–3. Quantity and price indexes for gross domestic product, and percent changes, 1965–2015 Year or quarter Gross domestic product (GDP) Real GDP (chaintype quantity index) GDP chaintype price index [Quarterly data are seasonally adjusted] Index numbers, 2009=100 Percent change from preceding period 1 GDP implicit price deflator Personal consumption expenditures (PCE) PCE chaintype price index PCE less food and energy price index Gross domestic purchases price index Gross domestic product (GDP) Real GDP (chaintype quantity index) GDP chaintype price index GDP implicit price deflator Personal consumption expenditures (PCE) PCE chaintype price index PCE less food and energy price index Gross domestic purchases price index 1965 27.580 18.744 18.702 18.681 19.325 18.321 6.5 1.8 1.8 1.4 1.3 1.7 1966 29.399 19.271 19.227 19.155 19.762 18.830 6.6 2.8 2.8 2.5 2.3 2.8 1967 30.205 19.831 19.786 19.637 20.367 19.346 2.7 2.9 2.9 2.5 3.1 2.7 1968 31.688 20.674 20.627 20.402 21.240 20.164 4.9 4.3 4.3 3.9 4.3 4.2 1969 32.683 21.691 21.642 21.326 22.238 21.149 3.1 4.9 4.9 4.5 4.7 4.9 1970 32.749 22.836 22.784 22.325 23.281 22.287 .2 5.3 5.3 4.7 4.7 5.4 1971 33.833 23.996 23.941 23.274 24.377 23.450 3.3 5.1 5.1 4.3 4.7 5.2 1972 35.609 25.035 24.978 24.070 25.165 24.498 5.2 4.3 4.3 3.4 3.2 4.5 1973 37.618 26.396 26.337 25.368 26.126 25.888 5.6 5.4 5.4 5.4 3.8 5.7 1974 37.424 28.760 28.703 28.009 28.196 28.511 –.5 9.0 9.0 10.4 7.9 10.1 1975 37.350 31.431 31.361 30.348 30.558 31.116 –.2 9.3 9.3 8.4 8.4 9.1 1976 39.361 33.157 33.083 32.013 32.415 32.821 5.4 5.5 5.5 5.5 6.1 5.5 1977 41.175 35.209 35.135 34.091 34.495 34.977 4.6 6.2 6.2 6.5 6.4 6.6 1978 43.466 37.680 37.602 36.479 36.802 37.459 5.6 7.0 7.0 7.0 6.7 7.1 1979 44.846 40.790 40.706 39.714 39.479 40.730 3.2 8.3 8.3 8.9 7.3 8.7 1980 44.736 44.480 44.377 43.978 43.093 44.963 –.2 9.0 9.0 10.7 9.2 10.4 1981 45.897 48.658 48.520 47.908 46.857 49.088 2.6 9.4 9.3 8.9 8.7 9.2 1982 45.020 51.624 51.530 50.553 49.881 51.876 –1.9 6.1 6.2 5.5 6.5 5.7 1983 47.105 53.658 53.565 52.729 52.466 53.697 4.6 3.9 3.9 4.3 5.2 3.5 1984 50.525 55.564 55.466 54.724 54.645 55.483 7.3 3.6 3.5 3.8 4.2 3.3 1985 52.666 57.341 57.240 56.661 56.898 57.151 4.2 3.2 3.2 3.5 4.1 3.0 1986 54.516 58.504 58.395 57.887 58.850 58.345 3.5 2.0 2.0 2.2 3.4 2.1 1987 56.403 59.935 59.885 59.650 60.719 59.985 3.5 2.4 2.6 3.0 3.2 2.8 1988 58.774 62.036 61.982 61.974 63.290 62.092 4.2 3.5 3.5 3.9 4.2 3.5 1989 60.937 64.448 64.392 64.641 65.869 64.516 3.7 3.9 3.9 4.3 4.1 3.9 1990 62.107 66.841 66.773 67.440 68.492 67.040 1.9 3.7 3.7 4.3 4.0 3.9 1991 62.061 69.057 68.996 69.652 70.886 69.112 –.1 3.3 3.3 3.3 3.5 3.1 1992 64.267 70.632 70.569 71.494 73.021 70.720 3.6 2.3 2.3 2.6 3.0 2.3 1993 66.032 72.315 72.248 73.279 75.008 72.324 2.7 2.4 2.4 2.5 2.7 2.3 1994 68.698 73.851 73.785 74.803 76.680 73.835 4.0 2.1 2.1 2.1 2.2 2.1 1995 70.566 75.393 75.324 76.356 78.324 75.421 2.7 2.1 2.1 2.1 2.1 2.1 1996 73.245 76.767 76.699 77.981 79.801 76.729 3.8 1.8 1.8 2.1 1.9 1.7 1997 76.531 78.088 78.012 79.327 81.196 77.852 4.5 1.7 1.7 1.7 1.7 1.5 1998 79.937 78.935 78.859 79.936 82.200 78.359 4.5 1.1 1.1 .8 1.2 .7 1999 83.682 80.065 80.065 81.110 83.291 79.579 4.7 1.4 1.5 1.5 1.3 1.6 2000 87.107 81.890 81.887 83.131 84.747 81.644 4.1 2.3 2.3 2.5 1.7 2.6 2001 87.957 83.755 83.754 84.736 86.281 83.209 1.0 2.3 2.3 1.9 1.8 1.9 2002 89.528 85.040 85.039 85.873 87.750 84.360 1.8 1.5 1.5 1.3 1.7 1.4 2003 92.041 86.735 86.735 87.572 89.047 86.196 2.8 2.0 2.0 2.0 1.5 2.2 2004 95.525 89.118 89.120 89.703 90.751 88.729 3.8 2.7 2.7 2.4 1.9 2.9 2005 98.720 91.985 91.988 92.261 92.711 91.851 3.3 3.2 3.2 2.9 2.2 3.5 2006 101.353 94.812 94.814 94.729 94.786 94.783 2.7 3.1 3.1 2.7 2.2 3.2 2007 103.156 97.340 97.337 97.102 96.832 97.372 1.8 2.7 2.7 2.5 2.2 2.7 2008 102.855 99.218 99.246 100.065 98.827 100.244 –.3 1.9 2.0 3.1 2.1 2.9 2009 100.000 100.000 100.000 100.000 100.000 100.000 –2.8 .8 .8 –.1 1.2 –.2 2010 102.532 101.226 101.221 101.653 101.286 101.527 2.5 1.2 1.2 1.7 1.3 1.5 2011 104.174 103.315 103.311 104.149 102.800 103.970 1.6 2.1 2.1 2.5 1.5 2.4 2012 106.491 105.220 105.214 106.121 104.741 105.805 2.2 1.8 1.8 1.9 1.9 1.8 2013 108.077 106.935 106.929 107.572 106.355 107.319 1.5 1.6 1.6 1.4 1.5 1.4 2014 110.701 108.694 108.686 109.105 107.981 108.982 2.4 1.6 1.6 1.4 1.5 1.5 2015 p 113.337 109.775 109.767 109.425 109.409 109.355 2.4 1.0 1.0 .3 1.3 .3 2012: I 106.050 104.466 104.466 105.563 104.101 105.274 2.7 2.1 2.1 2.3 2.3 2.4 II 106.545 104.930 104.943 105.885 104.589 105.579 1.9 1.8 1.8 1.2 1.9 1.2 III 106.672 105.547 105.508 106.232 104.912 105.930 .5 2.4 2.2 1.3 1.2 1.3 IV 106.696 105.937 105.935 106.804 105.363 106.439 .1 1.5 1.6 2.2 1.7 1.9 2013: I 107.202 106.333 106.363 107.166 105.819 106.807 1.9 1.5 1.6 1.4 1.7 1.4 II 107.501 106.625 106.623 107.284 106.140 107.020 1.1 1.1 1.0 .4 1.2 .8 III 108.293 107.154 107.128 107.728 106.508 107.479 3.0 2.0 1.9 1.7 1.4 1.7 IV 109.313 107.630 107.589 108.108 106.954 107.969 3.8 1.8 1.7 1.4 1.7 1.8 2014: I 109.059 108.025 108.009 108.540 107.334 108.390 –.9 1.5 1.6 1.6 1.4 1.6 II 110.283 108.621 108.606 109.117 107.860 108.910 4.6 2.2 2.2 2.1 2.0 1.9 III 111.444 109.049 109.044 109.441 108.232 109.325 4.3 1.6 1.6 1.2 1.4 1.5 IV 112.017 109.081 109.067 109.322 108.498 109.304 2.1 .1 .1 –.4 1.0 –.1 2015: I 112.196 109.112 109.099 108.795 108.758 108.864 .6 .1 .1 –1.9 1.0 –1.6 II 113.280 109.685 109.674 109.391 109.264 109.271 3.9 2.1 2.1 2.2 1.9 1.5 III 113.838 110.045 110.029 109.740 109.636 109.614 2.0 1.3 1.3 1.3 1.4 1.3 IV p 114.034 110.260 110.254 109.775 109.976 109.672 .7 .8 .8 .1 1.2 .2 1 Quarterly percent changes are at annual rates. Source: Department of Commerce (Bureau of Economic Analysis). 404 | Appendix B
- Page 1 and 2:
ECONOMIC REPORT OF THE PRESIDENT To
- Page 4:
C O N T E N T S ECONOMIC REPORT OF
- Page 8 and 9:
economic report of the president To
- Page 10 and 11:
when a hardworking American loses h
- Page 12:
the annual report of the council of
- Page 16 and 17:
C O N T E N T S CHAPTER 1 INCLUSIVE
- Page 18 and 19:
CHAPTER 5 TECHNOLOGY AND INNOVATION
- Page 20 and 21:
APPENDIXES A. Report to the Preside
- Page 22 and 23:
3.4. Percent Gap Between Actual and
- Page 24 and 25:
6.6. Relationship between Output Gr
- Page 26 and 27:
C H A P T E R 1 INCLUSIVE GROWTH IN
- Page 28 and 29:
To promote inclusive growth, both c
- Page 30 and 31:
Percent 20 15 Figure 1-1 Share of I
- Page 32 and 33:
Table 1-1 Increase in Income Share
- Page 34 and 35:
Figure 1-3 Distribution of Househol
- Page 36 and 37:
narrows the pool of human capital t
- Page 38 and 39:
over the past several decades has b
- Page 40 and 41:
Figure 1-6a The "Great Gatsby Curve
- Page 42 and 43:
Figure 1-7 Change in Employment by
- Page 44 and 45:
and sellers—consumer and producer
- Page 46 and 47:
Percent 15 10 Figure 1-9 Corporate
- Page 48 and 49:
Percent 30 Figure 1-11 Share of Wor
- Page 50 and 51:
Figure 1-12 Real Construction Costs
- Page 52 and 53:
promoting equality of opportunity;
- Page 54 and 55:
the division of rents, they can red
- Page 56 and 57:
C H A P T E R 2 THE YEAR IN REVIEW
- Page 58 and 59:
cold weather.1 The economy rebounde
- Page 60 and 61:
Box 2-1: Impact of Oil Price Declin
- Page 62 and 63:
Roughly speaking, the decline in th
- Page 64 and 65:
Percent of GDP 10 Figure 2-3 Federa
- Page 66 and 67:
Figure 2-5 Government Purchases as
- Page 68 and 69:
13 percent of GDP. Until 1990, Stat
- Page 70 and 71:
of new purchases.2 The increase in
- Page 72 and 73:
Figure 2-8 Actual and Consensus For
- Page 74 and 75:
Figure 2-10 Rates of Part-Time Work
- Page 76 and 77:
less than a tenth of the overall de
- Page 78 and 79:
Business fixed investment grew 3.1
- Page 80 and 81:
Percent 10 Figure 2-14 Personal Sav
- Page 82 and 83:
BEA revises the official statistics
- Page 84 and 85:
Index* 100 Figure 2-16 Real Income
- Page 86 and 87:
Box 2-5: Are Official Estimates of
- Page 88 and 89:
of consumer surplus, which should,
- Page 90 and 91:
Figure 2-19 National House Price In
- Page 92 and 93:
Box 2-6: Constraints on Housing Sup
- Page 94 and 95:
and also was estimated in recent re
- Page 96 and 97:
market. Nevertheless, the construct
- Page 98 and 99:
Figure 2-23 Net Investment as a Sha
- Page 100 and 101:
Percent 80 Figure 2-25 Total Payout
- Page 102 and 103:
Figure 2-28 Foreign Real GDP and U.
- Page 104 and 105:
Figure 2-30 Sources of Productivity
- Page 106 and 107:
Figure 2-32 Nominal Wage Growth Ove
- Page 108 and 109:
Figure 2-35 Long-Term Inflation Exp
- Page 110 and 111:
Percent 18 Figure 2-36 Nominal 10-Y
- Page 112 and 113:
Table 2-1 Selected Interest Rates,
- Page 114 and 115:
are close to those projected by the
- Page 116 and 117:
International Economics (Petri and
- Page 118 and 119:
History Forecast 1953:Q2 to 2015:Q3
- Page 120 and 121:
inflation up to 2007 and then expec
- Page 122:
Upside and Downside Forecast Risks.
- Page 125 and 126:
earlier forecasts. Figure 3-1 shows
- Page 127 and 128:
Real GDP/WAP Growth 2011-2014 Figur
- Page 129 and 130:
economists would expect capital dee
- Page 131 and 132:
Figure 3-i Actual and Forecasted Wo
- Page 133 and 134:
affected the demographic trajectory
- Page 135 and 136:
over the first three quarters of 20
- Page 137 and 138:
Percentage Points 35 30 Figure 3-7
- Page 139 and 140:
the President for a discussion of t
- Page 141 and 142:
Box 3-2: Market Volatility in the S
- Page 143 and 144:
potential for rapid spillovers betw
- Page 145 and 146:
absorb unexpectedly high losses. In
- Page 147 and 148:
Box 3-3: Commodity Prices and Infla
- Page 149 and 150:
In November 2015, the IMF voted to
- Page 151 and 152:
Billions of U.S. Dollars 250 200 15
- Page 153 and 154:
U.S. exports are 12.5 percent of th
- Page 155 and 156:
Box 3-4: The Importance of the Tran
- Page 157 and 158:
The challenging environment for U.S
- Page 159 and 160:
child’s environment. Despite the
- Page 161 and 162:
and Rossin-Slater 2015).5 These adv
- Page 163 and 164:
Figure 4-2 Official Poverty Rate fo
- Page 165 and 166:
Figure 4-3 Likelihood of Scoring Ve
- Page 167 and 168:
Percent 100 90 80 70 60 50 40 30 20
- Page 169 and 170:
Figure 4-7 Achievement Gap is Large
- Page 171 and 172:
Hours per Week 24 22 20 Figure 4-9
- Page 173 and 174:
Percent 65 Figure 4-11 Preschool En
- Page 175 and 176:
Box 4-1: Gender Differences in Earl
- Page 177 and 178:
Card and Rothstein 2007; Dickerson
- Page 179 and 180:
depend on how parents choose to inv
- Page 181 and 182:
y many factors, which makes it diff
- Page 183 and 184:
Box 4-3: Federal Early Childhood Pr
- Page 185 and 186:
program served over 45 million Amer
- Page 187 and 188:
Reauthorization Act of 2015, signed
- Page 189 and 190:
document that desegregation of hosp
- Page 191 and 192:
to alleviate hunger by supplementin
- Page 193 and 194:
adulthood (Hoynes, Schanzenbach, an
- Page 195 and 196:
of preschoolers support their child
- Page 197 and 198:
program and up to 15 years after co
- Page 199 and 200:
a longer period than is true of mos
- Page 201 and 202:
to be higher today than in the past
- Page 203 and 204:
Figure 4-18 Most Early Childhood Pr
- Page 205 and 206:
the preschool programs in Georgia a
- Page 207 and 208:
test scores by 6 to 9 percent of a
- Page 209 and 210:
Figure 4-20 Increase in Probability
- Page 211 and 212:
increased earnings by 31 percent (F
- Page 213 and 214:
Figure 5-1 Labor Productivity Growt
- Page 215 and 216:
Competition and Dynamism Play a Cri
- Page 217 and 218:
adopts pre-existing technology or k
- Page 219 and 220:
Figure 5-2 Quantity and Volume of V
- Page 221 and 222:
Box 5-2: Occupational Licensing One
- Page 223 and 224:
in consumer welfare as they erode t
- Page 225 and 226:
Finally, some workers may acquire s
- Page 227 and 228:
Box 5-3: Major Research Initiatives
- Page 229 and 230:
Figure 5-5 Federal and Nonfederal R
- Page 231 and 232:
Figure 5-7 Federal Research and Dev
- Page 233 and 234:
Figure 5-10 Percent of Patent Appli
- Page 235 and 236:
percent of all cases in 2009 to ove
- Page 237 and 238:
(Bloom, Sadun, and Van Reenen 2012)
- Page 239 and 240:
Figure 5-12 Estimated Annual Shipme
- Page 241 and 242:
was relatively flat through the 200
- Page 243 and 244:
In contrast, recent papers by Autor
- Page 245 and 246:
services, such as 4G LTE. At the sa
- Page 247 and 248:
Box 5-5: The On-Demand Economy “O
- Page 249 and 250:
vision of services that may not hav
- Page 251 and 252:
Figure 5-17 Household Income and Ho
- Page 253 and 254:
about half since ConnectED was laun
- Page 256 and 257:
C H A P T E R 6 THE ECONOMIC BENEFI
- Page 258 and 259:
enefits to a wide set of consumers
- Page 260 and 261:
Figure 6-1 Composition of Public Sp
- Page 262 and 263:
Age, Years 29 27 Figure 6-3 Average
- Page 264 and 265:
Type CAN FRA DEU ITA JPN GBR USA 20
- Page 266 and 267:
Box 6-1: Clean Energy and Transport
- Page 268 and 269:
Industry Government Investment Dire
- Page 270 and 271:
infrastructure investment is crucia
- Page 272 and 273:
Box 6-2: Elasticity of Output to Pu
- Page 274 and 275:
and output ignore potential inter-t
- Page 276 and 277:
Thus, ideas are exchanged, workers
- Page 278 and 279:
kilometers of road) in 1983 resulte
- Page 280 and 281:
Prospects for Increased Infrastruct
- Page 282 and 283:
Figure 6-6 Relationship between Out
- Page 284 and 285:
there is a clear demand for an infr
- Page 286 and 287:
user fees or shadow tolls.11 Throug
- Page 288 and 289:
to transportation facilities caused
- Page 290 and 291:
Tax-Exempt Bonds Transportation inf
- Page 292 and 293:
Recent Legislation In December 2015
- Page 294 and 295:
enefit freight movements. The Act a
- Page 296 and 297:
C H A P T E R 7 THE 70 TH ANNIVERSA
- Page 298 and 299:
and composition of the labor force,
- Page 300 and 301:
it, “[t]he CEA and its chairman h
- Page 302 and 303:
jected reductions in the deficit. I
- Page 304 and 305:
example, the Environmental Protecti
- Page 306 and 307:
Keyserling and the Council particip
- Page 308 and 309:
Countercyclical Policy in Other Adm
- Page 310 and 311:
In designing the Recovery Act, one
- Page 312 and 313:
incorporating risk and discounting
- Page 314 and 315:
and Freddie had lots of friends in
- Page 316 and 317:
(USEC). USEC was responsible for pr
- Page 318 and 319:
can be reported to him as the perce
- Page 320 and 321:
By contrast, Keyserling had activel
- Page 322 and 323:
goals of the government in their ar
- Page 324 and 325:
Gather, Analyze, and Interpret Info
- Page 326 and 327:
the unemployment insurance system w
- Page 328 and 329:
an informational basis for appropri
- Page 330 and 331:
had experience working in governmen
- Page 332 and 333:
emained. I joined forces with Budge
- Page 334:
Of course, relying on short-term ac
- Page 337 and 338:
Carson, Ann. 2015. “Prisoners in
- Page 339 and 340:
Kleiner, Morris M. and Alan B. Krue
- Page 341 and 342:
Congressional Budget Office (CBO).
- Page 343 and 344:
Kocin, Paul J. and Louis Uccellini.
- Page 345 and 346:
Fajgelbaum, Pablo and Amit Khandelw
- Page 347 and 348:
World Bank. 2016. “Global Economi
- Page 349 and 350:
Belfield, Clive R., Milagros Nores,
- Page 351 and 352:
Campbell, Jennifer A., Rebekah J. W
- Page 353 and 354:
Council of Economic Advisers. 2014.
- Page 355 and 356:
Eissa, Nada and Jeffrey B. Liebman.
- Page 357 and 358: Hastings, Justine S. and Ebonya Was
- Page 359 and 360: Kalil, Ariel, Rebecca Ryan, and Mic
- Page 361 and 362: Maxfield, Michelle. 2013. “The Ef
- Page 363 and 364: Olds, David, John Eckenrode, Charle
- Page 365 and 366: Solon, Gary. 1992. “Intergenerati
- Page 367 and 368: Wherry, Laura R., Sarah Miller, Rob
- Page 369 and 370: Bloom, Nicholas, Mark Schankerman,
- Page 371 and 372: Graham, Stuart JH, Cheryl Grim, Tar
- Page 373 and 374: Melitz, Marc J. 2003. “The Impact
- Page 375 and 376: ______. 2015. “Patent Assertions:
- Page 377 and 378: Congressional Budget Office. 2009.
- Page 379 and 380: Peshkin, David G., Todd E. Hoerner,
- Page 381 and 382: ______. 2001. Designing U.S. Econom
- Page 383 and 384: Krueger, Alan B. 2000. “Honest Br
- Page 385 and 386: Weidenbaum, Murray L. 1983. “An E
- Page 388 and 389: letter of transmittal Council of Ec
- Page 390: Council Members and Their Dates of
- Page 393 and 394: The Members of the Council Sandra E
- Page 395 and 396: In May, the Council issued a report
- Page 397 and 398: Nirupama S. Rao . . . . . . . . . .
- Page 399 and 400: Jessica Schumer resigned from her p
- Page 402 and 403: C O N T E N T S GDP, INCOME, PRICES
- Page 404 and 405: General Notes Detail in these table
- Page 406 and 407: Table B-1. Percent changes in real
- Page 410 and 411: Table B-4. Growth rates in real gro
- Page 412 and 413: Year or quarter Total Table B-6. Co
- Page 414 and 415: Table B-8. New private housing unit
- Page 416 and 417: Table B-10. Changes in consumer pri
- Page 418 and 419: Table B-11. Civilian labor force, 1
- Page 420 and 421: Year or month Table B-13. Unemploym
- Page 422 and 423: Table B-14. Employees on nonagricul
- Page 424 and 425: Year or quarter Table B-16. Product
- Page 426 and 427: Table B-18. Federal receipts, outla
- Page 428 and 429: Table B-20. Federal receipts, outla
- Page 430 and 431: Table B-22. State and local governm
- Page 432 and 433: End of month Table B-24. Estimated
- Page 434 and 435: Table B-25. Bond yields and interes