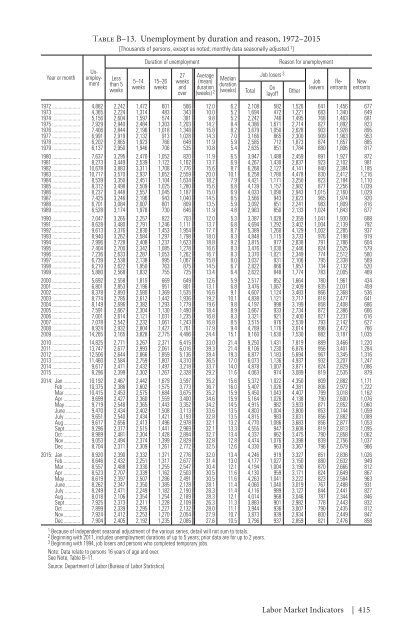
Year or month Table B–13. Unemployment by duration and reason, 1972–2015 [Thousands of persons, except as noted; monthly data seasonally adjusted 1 ] Less than 5 weeks 5–14 weeks Duration of unemployment 15–26 weeks 27 weeks and over Average (mean) duration (weeks) 2 Median duration (weeks) Job losers 3 Reason for unemployment Job leavers Unemployment Reentrants New entrants 1972 4,882 2,242 1,472 601 566 12.0 6.2 2,108 582 1,526 641 1,456 677 1973 4,365 2,224 1,314 483 343 10.0 5.2 1,694 472 1,221 683 1,340 649 1974 5,156 2,604 1,597 574 381 9.8 5.2 2,242 746 1,495 768 1,463 681 1975 7,929 2,940 2,484 1,303 1,203 14.2 8.4 4,386 1,671 2,714 827 1,892 823 1976 7,406 2,844 2,196 1,018 1,348 15.8 8.2 3,679 1,050 2,628 903 1,928 895 1977 6,991 2,919 2,132 913 1,028 14.3 7.0 3,166 865 2,300 909 1,963 953 1978 6,202 2,865 1,923 766 648 11.9 5.9 2,585 712 1,873 874 1,857 885 1979 6,137 2,950 1,946 706 535 10.8 5.4 2,635 851 1,784 880 1,806 817 1980 7,637 3,295 2,470 1,052 820 11.9 6.5 3,947 1,488 2,459 891 1,927 872 1981 8,273 3,449 2,539 1,122 1,162 13.7 6.9 4,267 1,430 2,837 923 2,102 981 1982 10,678 3,883 3,311 1,708 1,776 15.6 8.7 6,268 2,127 4,141 840 2,384 1,185 1983 10,717 3,570 2,937 1,652 2,559 20.0 10.1 6,258 1,780 4,478 830 2,412 1,216 1984 8,539 3,350 2,451 1,104 1,634 18.2 7.9 4,421 1,171 3,250 823 2,184 1,110 1985 8,312 3,498 2,509 1,025 1,280 15.6 6.8 4,139 1,157 2,982 877 2,256 1,039 1986 8,237 3,448 2,557 1,045 1,187 15.0 6.9 4,033 1,090 2,943 1,015 2,160 1,029 1987 7,425 3,246 2,196 943 1,040 14.5 6.5 3,566 943 2,623 965 1,974 920 1988 6,701 3,084 2,007 801 809 13.5 5.9 3,092 851 2,241 983 1,809 816 1989 6,528 3,174 1,978 730 646 11.9 4.8 2,983 850 2,133 1,024 1,843 677 1990 7,047 3,265 2,257 822 703 12.0 5.3 3,387 1,028 2,359 1,041 1,930 688 1991 8,628 3,480 2,791 1,246 1,111 13.7 6.8 4,694 1,292 3,402 1,004 2,139 792 1992 9,613 3,376 2,830 1,453 1,954 17.7 8.7 5,389 1,260 4,129 1,002 2,285 937 1993 8,940 3,262 2,584 1,297 1,798 18.0 8.3 4,848 1,115 3,733 976 2,198 919 1994 7,996 2,728 2,408 1,237 1,623 18.8 9.2 3,815 977 2,838 791 2,786 604 1995 7,404 2,700 2,342 1,085 1,278 16.6 8.3 3,476 1,030 2,446 824 2,525 579 1996 7,236 2,633 2,287 1,053 1,262 16.7 8.3 3,370 1,021 2,349 774 2,512 580 1997 6,739 2,538 2,138 995 1,067 15.8 8.0 3,037 931 2,106 795 2,338 569 1998 6,210 2,622 1,950 763 875 14.5 6.7 2,822 866 1,957 734 2,132 520 1999 5,880 2,568 1,832 755 725 13.4 6.4 2,622 848 1,774 783 2,005 469 2000 5,692 2,558 1,815 669 649 12.6 5.9 2,517 852 1,664 780 1,961 434 2001 6,801 2,853 2,196 951 801 13.1 6.8 3,476 1,067 2,409 835 2,031 459 2002 8,378 2,893 2,580 1,369 1,535 16.6 9.1 4,607 1,124 3,483 866 2,368 536 2003 8,774 2,785 2,612 1,442 1,936 19.2 10.1 4,838 1,121 3,717 818 2,477 641 2004 8,149 2,696 2,382 1,293 1,779 19.6 9.8 4,197 998 3,199 858 2,408 686 2005 7,591 2,667 2,304 1,130 1,490 18.4 8.9 3,667 933 2,734 872 2,386 666 2006 7,001 2,614 2,121 1,031 1,235 16.8 8.3 3,321 921 2,400 827 2,237 616 2007 7,078 2,542 2,232 1,061 1,243 16.8 8.5 3,515 976 2,539 793 2,142 627 2008 8,924 2,932 2,804 1,427 1,761 17.9 9.4 4,789 1,176 3,614 896 2,472 766 2009 14,265 3,165 3,828 2,775 4,496 24.4 15.1 9,160 1,630 7,530 882 3,187 1,035 2010 14,825 2,771 3,267 2,371 6,415 33.0 21.4 9,250 1,431 7,819 889 3,466 1,220 2011 13,747 2,677 2,993 2,061 6,016 39.3 21.4 8,106 1,230 6,876 956 3,401 1,284 2012 12,506 2,644 2,866 1,859 5,136 39.4 19.3 6,877 1,183 5,694 967 3,345 1,316 2013 11,460 2,584 2,759 1,807 4,310 36.5 17.0 6,073 1,136 4,937 932 3,207 1,247 2014 9,617 2,471 2,432 1,497 3,218 33.7 14.0 4,878 1,007 3,871 824 2,829 1,086 2015 8,296 2,399 2,302 1,267 2,328 29.2 11.6 4,063 974 3,089 819 2,535 879 2014: Jan 10,192 2,467 2,442 1,679 3,597 35.2 15.6 5,372 1,022 4,350 809 2,882 1,171 Feb 10,375 2,386 2,602 1,575 3,773 36.7 16.0 5,407 1,026 4,381 806 2,972 1,222 Mar 10,415 2,453 2,575 1,684 3,675 35.2 15.9 5,450 1,043 4,407 799 3,018 1,162 Apr 9,699 2,427 2,360 1,559 3,400 34.6 15.9 5,164 1,026 4,138 790 2,600 1,076 May 9,719 2,548 2,365 1,443 3,352 34.2 14.5 4,915 982 3,933 871 2,852 1,060 June 9,470 2,434 2,402 1,508 3,113 33.6 13.5 4,803 1,004 3,800 853 2,744 1,059 July 9,651 2,540 2,434 1,421 3,193 32.8 13.5 4,815 983 3,831 856 2,882 1,089 Aug 9,617 2,656 2,413 1,496 2,978 32.1 13.2 4,770 1,086 3,683 856 2,877 1,053 Sept 9,296 2,377 2,515 1,441 2,969 32.1 13.3 4,555 947 3,608 819 2,813 1,095 Oct 8,989 2,481 2,304 1,428 2,894 32.7 13.4 4,337 862 3,475 790 2,858 1,062 Nov 9,053 2,494 2,374 1,399 2,829 32.8 12.8 4,474 1,076 3,398 839 2,756 1,037 Dec 8,704 2,371 2,309 1,261 2,772 32.5 12.6 4,330 963 3,367 796 2,679 966 2015: Jan 8,920 2,390 2,332 1,371 2,776 32.0 13.4 4,246 919 3,327 851 2,836 1,026 Feb 8,646 2,432 2,251 1,317 2,677 31.4 13.0 4,177 1,027 3,150 880 2,632 949 Mar 8,557 2,488 2,330 1,255 2,547 30.4 12.1 4,194 1,004 3,190 870 2,666 812 Apr 8,523 2,707 2,339 1,162 2,503 30.5 11.6 4,130 959 3,171 824 2,649 867 May 8,619 2,397 2,507 1,286 2,491 30.5 11.6 4,263 1,041 3,222 823 2,584 963 June 8,262 2,347 2,350 1,385 2,128 28.1 11.4 4,060 1,040 3,019 767 2,488 931 July 8,249 2,471 2,249 1,182 2,190 28.3 11.4 4,116 989 3,127 844 2,441 827 Aug 8,018 2,106 2,354 1,254 2,189 28.3 12.1 4,014 968 3,046 787 2,344 846 Sept 7,925 2,373 2,211 1,228 2,109 26.3 11.3 3,883 901 2,982 778 2,443 832 Oct 7,899 2,339 2,295 1,227 2,132 28.0 11.1 3,944 936 3,007 790 2,435 812 Nov 7,924 2,412 2,253 1,270 2,054 27.9 10.7 3,873 939 2,934 800 2,449 847 Dec 7,904 2,405 2,192 1,235 2,085 27.6 10.5 3,796 937 2,859 821 2,476 858 1 Because of independent seasonal adjustment of the various series, detail will not sum to totals. 2 Beginning with 2011, includes unemployment durations of up to 5 years; prior data are for up to 2 years. 3 Beginning with 1994, job losers and persons who completed temporary jobs. Note: Data relate to persons 16 years of age and over. See Note, Table B–11. Source: Department of Labor (Bureau of Labor Statistics). Total On layoff Other Labor Market Indicators | 415
Table B–14. Employees on nonagricultural payrolls, by major industry, 1972–2015 [Thousands of jobs; monthly data seasonally adjusted] Year or month Total private Total Mining and logging Private industries Goods-producing industries Total Manufacturing Durable goods Total nonagricultural employment Construction Nondurable goods Private service-providing industries Total Trade, transportation, and utilities 1 1972 73,798 60,333 22,299 672 3,957 17,669 10,630 7,039 38,034 14,788 8,038 1973 76,912 63,050 23,450 693 4,167 18,589 11,414 7,176 39,600 15,349 8,371 1974 78,389 64,086 23,364 755 4,095 18,514 11,432 7,082 40,721 15,693 8,536 1975 77,069 62,250 21,318 802 3,608 16,909 10,266 6,643 40,932 15,606 8,600 1976 79,502 64,501 22,025 832 3,662 17,531 10,640 6,891 42,476 16,128 8,966 1977 82,593 67,334 22,972 865 3,940 18,167 11,132 7,035 44,362 16,765 9,359 1978 86,826 71,014 24,156 902 4,322 18,932 11,770 7,162 46,858 17,658 9,879 1979 89,933 73,865 24,997 1,008 4,562 19,426 12,220 7,206 48,869 18,303 10,180 1980 90,533 74,158 24,263 1,077 4,454 18,733 11,679 7,054 49,895 18,413 10,244 1981 91,297 75,117 24,118 1,180 4,304 18,634 11,611 7,023 50,999 18,604 10,364 1982 89,689 73,706 22,550 1,163 4,024 17,363 10,610 6,753 51,156 18,457 10,372 1983 90,295 74,284 22,110 997 4,065 17,048 10,326 6,722 52,174 18,668 10,635 1984 94,548 78,389 23,435 1,014 4,501 17,920 11,050 6,870 54,954 19,653 11,223 1985 97,532 81,000 23,585 974 4,793 17,819 11,034 6,784 57,415 20,379 11,733 1986 99,500 82,661 23,318 829 4,937 17,552 10,795 6,757 59,343 20,795 12,078 1987 102,116 84,960 23,470 771 5,090 17,609 10,767 6,842 61,490 21,302 12,419 1988 105,378 87,838 23,909 770 5,233 17,906 10,969 6,938 63,929 21,974 12,808 1989 108,051 90,124 24,045 750 5,309 17,985 11,004 6,981 66,079 22,510 13,108 1990 109,527 91,112 23,723 765 5,263 17,695 10,737 6,958 67,389 22,666 13,182 1991 108,427 89,881 22,588 739 4,780 17,068 10,220 6,848 67,293 22,281 12,896 1992 108,802 90,015 22,095 689 4,608 16,799 9,946 6,853 67,921 22,125 12,828 1993 110,935 91,946 22,219 666 4,779 16,774 9,901 6,872 69,727 22,378 13,021 1994 114,398 95,124 22,774 659 5,095 17,020 10,132 6,889 72,350 23,128 13,491 1995 117,407 97,975 23,156 641 5,274 17,241 10,373 6,868 74,819 23,834 13,897 1996 119,836 100,297 23,409 637 5,536 17,237 10,486 6,751 76,888 24,239 14,143 1997 122,951 103,287 23,886 654 5,813 17,419 10,705 6,714 79,401 24,700 14,389 1998 126,157 106,248 24,354 645 6,149 17,560 10,911 6,649 81,894 25,186 14,609 1999 129,240 108,933 24,465 598 6,545 17,322 10,831 6,491 84,468 25,771 14,970 2000 132,024 111,235 24,649 599 6,787 17,263 10,877 6,386 86,585 26,225 15,280 2001 132,087 110,969 23,873 606 6,826 16,441 10,336 6,105 87,096 25,983 15,239 2002 130,649 109,136 22,557 583 6,716 15,259 9,485 5,774 86,579 25,497 15,025 2003 130,347 108,764 21,816 572 6,735 14,509 8,964 5,546 86,948 25,287 14,917 2004 131,787 110,166 21,882 591 6,976 14,315 8,925 5,390 88,284 25,533 15,058 2005 134,051 112,247 22,190 628 7,336 14,227 8,956 5,271 90,057 25,959 15,280 2006 136,453 114,479 22,530 684 7,691 14,155 8,981 5,174 91,949 26,276 15,353 2007 137,999 115,781 22,233 724 7,630 13,879 8,808 5,071 93,548 26,630 15,520 2008 137,242 114,732 21,335 767 7,162 13,406 8,463 4,943 93,398 26,293 15,283 2009 131,313 108,758 18,558 694 6,016 11,847 7,284 4,564 90,201 24,906 14,522 2010 130,361 107,871 17,751 705 5,518 11,528 7,064 4,464 90,120 24,636 14,440 2011 131,932 109,845 18,047 788 5,533 11,726 7,273 4,453 91,798 25,065 14,668 2012 134,175 112,255 18,420 848 5,646 11,927 7,470 4,457 93,834 25,476 14,841 2013 136,381 114,529 18,738 863 5,856 12,020 7,548 4,472 95,791 25,862 15,079 2014 138,958 117,076 19,226 891 6,151 12,185 7,674 4,512 97,850 26,383 15,357 2015 p 141,865 119,858 19,583 820 6,446 12,317 7,755 4,562 100,275 26,920 15,641 2014: Jan 137,574 115,767 18,966 873 5,999 12,094 7,591 4,503 96,801 26,147 15,259 Feb 137,742 115,925 19,010 875 6,020 12,115 7,610 4,505 96,915 26,142 15,241 Mar 138,014 116,186 19,066 879 6,062 12,125 7,624 4,501 97,120 26,182 15,262 Apr 138,324 116,468 19,127 885 6,103 12,139 7,634 4,505 97,341 26,253 15,301 May 138,537 116,683 19,146 885 6,115 12,146 7,647 4,499 97,537 26,293 15,310 June 138,843 116,950 19,189 890 6,128 12,171 7,667 4,504 97,761 26,361 15,347 July 139,075 117,194 19,254 896 6,169 12,189 7,684 4,505 97,940 26,410 15,369 Aug 139,293 117,425 19,297 898 6,194 12,205 7,696 4,509 98,128 26,434 15,377 Sept 139,579 117,662 19,340 904 6,219 12,217 7,704 4,513 98,322 26,484 15,406 Oct 139,779 117,852 19,378 902 6,233 12,243 7,723 4,520 98,474 26,529 15,420 Nov 140,110 118,176 19,428 900 6,256 12,272 7,740 4,532 98,748 26,615 15,478 Dec 140,402 118,455 19,492 897 6,301 12,294 7,754 4,540 98,963 26,656 15,477 2015: Jan 140,623 118,669 19,552 890 6,351 12,311 7,764 4,547 99,117 26,698 15,510 Feb 140,888 118,921 19,568 875 6,378 12,315 7,769 4,546 99,353 26,750 15,539 Mar 140,972 119,011 19,548 859 6,371 12,318 7,769 4,549 99,463 26,788 15,564 Apr 141,223 119,252 19,569 844 6,409 12,316 7,765 4,551 99,683 26,815 15,578 May 141,496 119,508 19,574 824 6,426 12,324 7,767 4,557 99,934 26,861 15,605 June 141,724 119,734 19,571 820 6,426 12,325 7,765 4,560 100,163 26,909 15,640 July 142,001 119,979 19,585 812 6,437 12,336 7,762 4,574 100,394 26,963 15,671 Aug 142,151 120,102 19,562 803 6,441 12,318 7,756 4,562 100,540 26,978 15,675 Sept 142,300 120,264 19,550 790 6,451 12,309 7,749 4,560 100,714 26,987 15,681 Oct 142,595 120,568 19,581 786 6,484 12,311 7,745 4,566 100,987 27,011 15,702 Nov 142,875 120,847 19,634 771 6,549 12,314 7,733 4,581 101,213 27,087 15,754 Dec p 143,137 121,098 19,688 764 6,597 12,327 7,734 4,593 101,410 27,109 15,753 1 Includes wholesale trade, transportation and warehousing, and utilities, not shown separately. Note: Data in Tables B–14 and B–15 are based on reports from employing establishments and relate to full- and part-time wage and salary workers in nonagricultural establishments who received pay for any part of the pay period that includes the 12th of the month. Not comparable with labor force data (Tables B–11 through B–13), which include proprietors, self-employed persons, unpaid family workers, and private household workers; which count persons as See next page for continuation of table. Total Retail trade 416 | Appendix B
- Page 1 and 2:
ECONOMIC REPORT OF THE PRESIDENT To
- Page 4:
C O N T E N T S ECONOMIC REPORT OF
- Page 8 and 9:
economic report of the president To
- Page 10 and 11:
when a hardworking American loses h
- Page 12:
the annual report of the council of
- Page 16 and 17:
C O N T E N T S CHAPTER 1 INCLUSIVE
- Page 18 and 19:
CHAPTER 5 TECHNOLOGY AND INNOVATION
- Page 20 and 21:
APPENDIXES A. Report to the Preside
- Page 22 and 23:
3.4. Percent Gap Between Actual and
- Page 24 and 25:
6.6. Relationship between Output Gr
- Page 26 and 27:
C H A P T E R 1 INCLUSIVE GROWTH IN
- Page 28 and 29:
To promote inclusive growth, both c
- Page 30 and 31:
Percent 20 15 Figure 1-1 Share of I
- Page 32 and 33:
Table 1-1 Increase in Income Share
- Page 34 and 35:
Figure 1-3 Distribution of Househol
- Page 36 and 37:
narrows the pool of human capital t
- Page 38 and 39:
over the past several decades has b
- Page 40 and 41:
Figure 1-6a The "Great Gatsby Curve
- Page 42 and 43:
Figure 1-7 Change in Employment by
- Page 44 and 45:
and sellers—consumer and producer
- Page 46 and 47:
Percent 15 10 Figure 1-9 Corporate
- Page 48 and 49:
Percent 30 Figure 1-11 Share of Wor
- Page 50 and 51:
Figure 1-12 Real Construction Costs
- Page 52 and 53:
promoting equality of opportunity;
- Page 54 and 55:
the division of rents, they can red
- Page 56 and 57:
C H A P T E R 2 THE YEAR IN REVIEW
- Page 58 and 59:
cold weather.1 The economy rebounde
- Page 60 and 61:
Box 2-1: Impact of Oil Price Declin
- Page 62 and 63:
Roughly speaking, the decline in th
- Page 64 and 65:
Percent of GDP 10 Figure 2-3 Federa
- Page 66 and 67:
Figure 2-5 Government Purchases as
- Page 68 and 69:
13 percent of GDP. Until 1990, Stat
- Page 70 and 71:
of new purchases.2 The increase in
- Page 72 and 73:
Figure 2-8 Actual and Consensus For
- Page 74 and 75:
Figure 2-10 Rates of Part-Time Work
- Page 76 and 77:
less than a tenth of the overall de
- Page 78 and 79:
Business fixed investment grew 3.1
- Page 80 and 81:
Percent 10 Figure 2-14 Personal Sav
- Page 82 and 83:
BEA revises the official statistics
- Page 84 and 85:
Index* 100 Figure 2-16 Real Income
- Page 86 and 87:
Box 2-5: Are Official Estimates of
- Page 88 and 89:
of consumer surplus, which should,
- Page 90 and 91:
Figure 2-19 National House Price In
- Page 92 and 93:
Box 2-6: Constraints on Housing Sup
- Page 94 and 95:
and also was estimated in recent re
- Page 96 and 97:
market. Nevertheless, the construct
- Page 98 and 99:
Figure 2-23 Net Investment as a Sha
- Page 100 and 101:
Percent 80 Figure 2-25 Total Payout
- Page 102 and 103:
Figure 2-28 Foreign Real GDP and U.
- Page 104 and 105:
Figure 2-30 Sources of Productivity
- Page 106 and 107:
Figure 2-32 Nominal Wage Growth Ove
- Page 108 and 109:
Figure 2-35 Long-Term Inflation Exp
- Page 110 and 111:
Percent 18 Figure 2-36 Nominal 10-Y
- Page 112 and 113:
Table 2-1 Selected Interest Rates,
- Page 114 and 115:
are close to those projected by the
- Page 116 and 117:
International Economics (Petri and
- Page 118 and 119:
History Forecast 1953:Q2 to 2015:Q3
- Page 120 and 121:
inflation up to 2007 and then expec
- Page 122:
Upside and Downside Forecast Risks.
- Page 125 and 126:
earlier forecasts. Figure 3-1 shows
- Page 127 and 128:
Real GDP/WAP Growth 2011-2014 Figur
- Page 129 and 130:
economists would expect capital dee
- Page 131 and 132:
Figure 3-i Actual and Forecasted Wo
- Page 133 and 134:
affected the demographic trajectory
- Page 135 and 136:
over the first three quarters of 20
- Page 137 and 138:
Percentage Points 35 30 Figure 3-7
- Page 139 and 140:
the President for a discussion of t
- Page 141 and 142:
Box 3-2: Market Volatility in the S
- Page 143 and 144:
potential for rapid spillovers betw
- Page 145 and 146:
absorb unexpectedly high losses. In
- Page 147 and 148:
Box 3-3: Commodity Prices and Infla
- Page 149 and 150:
In November 2015, the IMF voted to
- Page 151 and 152:
Billions of U.S. Dollars 250 200 15
- Page 153 and 154:
U.S. exports are 12.5 percent of th
- Page 155 and 156:
Box 3-4: The Importance of the Tran
- Page 157 and 158:
The challenging environment for U.S
- Page 159 and 160:
child’s environment. Despite the
- Page 161 and 162:
and Rossin-Slater 2015).5 These adv
- Page 163 and 164:
Figure 4-2 Official Poverty Rate fo
- Page 165 and 166:
Figure 4-3 Likelihood of Scoring Ve
- Page 167 and 168:
Percent 100 90 80 70 60 50 40 30 20
- Page 169 and 170:
Figure 4-7 Achievement Gap is Large
- Page 171 and 172:
Hours per Week 24 22 20 Figure 4-9
- Page 173 and 174:
Percent 65 Figure 4-11 Preschool En
- Page 175 and 176:
Box 4-1: Gender Differences in Earl
- Page 177 and 178:
Card and Rothstein 2007; Dickerson
- Page 179 and 180:
depend on how parents choose to inv
- Page 181 and 182:
y many factors, which makes it diff
- Page 183 and 184:
Box 4-3: Federal Early Childhood Pr
- Page 185 and 186:
program served over 45 million Amer
- Page 187 and 188:
Reauthorization Act of 2015, signed
- Page 189 and 190:
document that desegregation of hosp
- Page 191 and 192:
to alleviate hunger by supplementin
- Page 193 and 194:
adulthood (Hoynes, Schanzenbach, an
- Page 195 and 196:
of preschoolers support their child
- Page 197 and 198:
program and up to 15 years after co
- Page 199 and 200:
a longer period than is true of mos
- Page 201 and 202:
to be higher today than in the past
- Page 203 and 204:
Figure 4-18 Most Early Childhood Pr
- Page 205 and 206:
the preschool programs in Georgia a
- Page 207 and 208:
test scores by 6 to 9 percent of a
- Page 209 and 210:
Figure 4-20 Increase in Probability
- Page 211 and 212:
increased earnings by 31 percent (F
- Page 213 and 214:
Figure 5-1 Labor Productivity Growt
- Page 215 and 216:
Competition and Dynamism Play a Cri
- Page 217 and 218:
adopts pre-existing technology or k
- Page 219 and 220:
Figure 5-2 Quantity and Volume of V
- Page 221 and 222:
Box 5-2: Occupational Licensing One
- Page 223 and 224:
in consumer welfare as they erode t
- Page 225 and 226:
Finally, some workers may acquire s
- Page 227 and 228:
Box 5-3: Major Research Initiatives
- Page 229 and 230:
Figure 5-5 Federal and Nonfederal R
- Page 231 and 232:
Figure 5-7 Federal Research and Dev
- Page 233 and 234:
Figure 5-10 Percent of Patent Appli
- Page 235 and 236:
percent of all cases in 2009 to ove
- Page 237 and 238:
(Bloom, Sadun, and Van Reenen 2012)
- Page 239 and 240:
Figure 5-12 Estimated Annual Shipme
- Page 241 and 242:
was relatively flat through the 200
- Page 243 and 244:
In contrast, recent papers by Autor
- Page 245 and 246:
services, such as 4G LTE. At the sa
- Page 247 and 248:
Box 5-5: The On-Demand Economy “O
- Page 249 and 250:
vision of services that may not hav
- Page 251 and 252:
Figure 5-17 Household Income and Ho
- Page 253 and 254:
about half since ConnectED was laun
- Page 256 and 257:
C H A P T E R 6 THE ECONOMIC BENEFI
- Page 258 and 259:
enefits to a wide set of consumers
- Page 260 and 261:
Figure 6-1 Composition of Public Sp
- Page 262 and 263:
Age, Years 29 27 Figure 6-3 Average
- Page 264 and 265:
Type CAN FRA DEU ITA JPN GBR USA 20
- Page 266 and 267:
Box 6-1: Clean Energy and Transport
- Page 268 and 269:
Industry Government Investment Dire
- Page 270 and 271:
infrastructure investment is crucia
- Page 272 and 273:
Box 6-2: Elasticity of Output to Pu
- Page 274 and 275:
and output ignore potential inter-t
- Page 276 and 277:
Thus, ideas are exchanged, workers
- Page 278 and 279:
kilometers of road) in 1983 resulte
- Page 280 and 281:
Prospects for Increased Infrastruct
- Page 282 and 283:
Figure 6-6 Relationship between Out
- Page 284 and 285:
there is a clear demand for an infr
- Page 286 and 287:
user fees or shadow tolls.11 Throug
- Page 288 and 289:
to transportation facilities caused
- Page 290 and 291:
Tax-Exempt Bonds Transportation inf
- Page 292 and 293:
Recent Legislation In December 2015
- Page 294 and 295:
enefit freight movements. The Act a
- Page 296 and 297:
C H A P T E R 7 THE 70 TH ANNIVERSA
- Page 298 and 299:
and composition of the labor force,
- Page 300 and 301:
it, “[t]he CEA and its chairman h
- Page 302 and 303:
jected reductions in the deficit. I
- Page 304 and 305:
example, the Environmental Protecti
- Page 306 and 307:
Keyserling and the Council particip
- Page 308 and 309:
Countercyclical Policy in Other Adm
- Page 310 and 311:
In designing the Recovery Act, one
- Page 312 and 313:
incorporating risk and discounting
- Page 314 and 315:
and Freddie had lots of friends in
- Page 316 and 317:
(USEC). USEC was responsible for pr
- Page 318 and 319:
can be reported to him as the perce
- Page 320 and 321:
By contrast, Keyserling had activel
- Page 322 and 323:
goals of the government in their ar
- Page 324 and 325:
Gather, Analyze, and Interpret Info
- Page 326 and 327:
the unemployment insurance system w
- Page 328 and 329:
an informational basis for appropri
- Page 330 and 331:
had experience working in governmen
- Page 332 and 333:
emained. I joined forces with Budge
- Page 334:
Of course, relying on short-term ac
- Page 337 and 338:
Carson, Ann. 2015. “Prisoners in
- Page 339 and 340:
Kleiner, Morris M. and Alan B. Krue
- Page 341 and 342:
Congressional Budget Office (CBO).
- Page 343 and 344:
Kocin, Paul J. and Louis Uccellini.
- Page 345 and 346:
Fajgelbaum, Pablo and Amit Khandelw
- Page 347 and 348:
World Bank. 2016. “Global Economi
- Page 349 and 350:
Belfield, Clive R., Milagros Nores,
- Page 351 and 352:
Campbell, Jennifer A., Rebekah J. W
- Page 353 and 354:
Council of Economic Advisers. 2014.
- Page 355 and 356:
Eissa, Nada and Jeffrey B. Liebman.
- Page 357 and 358:
Hastings, Justine S. and Ebonya Was
- Page 359 and 360:
Kalil, Ariel, Rebecca Ryan, and Mic
- Page 361 and 362:
Maxfield, Michelle. 2013. “The Ef
- Page 363 and 364:
Olds, David, John Eckenrode, Charle
- Page 365 and 366:
Solon, Gary. 1992. “Intergenerati
- Page 367 and 368:
Wherry, Laura R., Sarah Miller, Rob
- Page 369 and 370: Bloom, Nicholas, Mark Schankerman,
- Page 371 and 372: Graham, Stuart JH, Cheryl Grim, Tar
- Page 373 and 374: Melitz, Marc J. 2003. “The Impact
- Page 375 and 376: ______. 2015. “Patent Assertions:
- Page 377 and 378: Congressional Budget Office. 2009.
- Page 379 and 380: Peshkin, David G., Todd E. Hoerner,
- Page 381 and 382: ______. 2001. Designing U.S. Econom
- Page 383 and 384: Krueger, Alan B. 2000. “Honest Br
- Page 385 and 386: Weidenbaum, Murray L. 1983. “An E
- Page 388 and 389: letter of transmittal Council of Ec
- Page 390: Council Members and Their Dates of
- Page 393 and 394: The Members of the Council Sandra E
- Page 395 and 396: In May, the Council issued a report
- Page 397 and 398: Nirupama S. Rao . . . . . . . . . .
- Page 399 and 400: Jessica Schumer resigned from her p
- Page 402 and 403: C O N T E N T S GDP, INCOME, PRICES
- Page 404 and 405: General Notes Detail in these table
- Page 406 and 407: Table B-1. Percent changes in real
- Page 408 and 409: Table B-2. Gross domestic product,
- Page 410 and 411: Table B-4. Growth rates in real gro
- Page 412 and 413: Year or quarter Total Table B-6. Co
- Page 414 and 415: Table B-8. New private housing unit
- Page 416 and 417: Table B-10. Changes in consumer pri
- Page 418 and 419: Table B-11. Civilian labor force, 1
- Page 422 and 423: Table B-14. Employees on nonagricul
- Page 424 and 425: Year or quarter Table B-16. Product
- Page 426 and 427: Table B-18. Federal receipts, outla
- Page 428 and 429: Table B-20. Federal receipts, outla
- Page 430 and 431: Table B-22. State and local governm
- Page 432 and 433: End of month Table B-24. Estimated
- Page 434 and 435: Table B-25. Bond yields and interes