

ECONOMIC REPORT OF THE PRESIDENT
YFksc
YFksc

You also want an ePaper? Increase the reach of your titles
YUMPU automatically turns print PDFs into web optimized ePapers that Google loves.
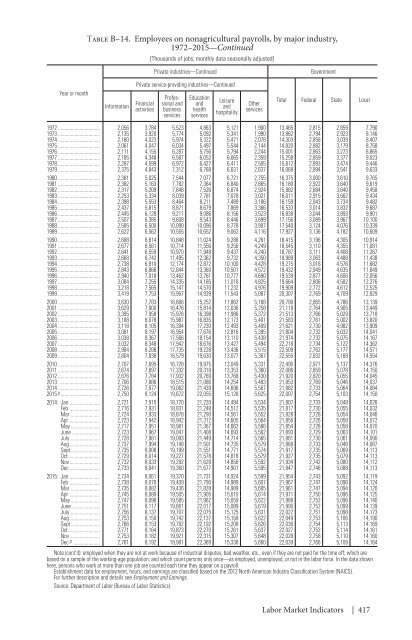
Table B–14. Employees on nonagricultural payrolls, by major industry,<br />
1972–2015—Continued<br />
[Thousands of jobs; monthly data seasonally adjusted]<br />
Private industries—Continued<br />
Government<br />
Year or month<br />
Information<br />
Private service-providing industries—Continued<br />
Financial<br />
activities<br />
Professional<br />
and<br />
business<br />
services<br />
Education<br />
and<br />
health<br />
services<br />
Leisure<br />
and<br />
hospitality<br />
Other<br />
services<br />
Total Federal State Local<br />
1972 2,056 3,784 5,523 4,863 5,121 1,900 13,465 2,815 2,859 7,790<br />
1973 2,135 3,920 5,774 5,092 5,341 1,990 13,862 2,794 2,923 8,146<br />
1974 2,160 4,023 5,974 5,322 5,471 2,078 14,303 2,858 3,039 8,407<br />
1975 2,061 4,047 6,034 5,497 5,544 2,144 14,820 2,882 3,179 8,758<br />
1976 2,111 4,155 6,287 5,756 5,794 2,244 15,001 2,863 3,273 8,865<br />
1977 2,185 4,348 6,587 6,052 6,065 2,359 15,258 2,859 3,377 9,023<br />
1978 2,287 4,599 6,972 6,427 6,411 2,505 15,812 2,893 3,474 9,446<br />
1979 2,375 4,843 7,312 6,768 6,631 2,637 16,068 2,894 3,541 9,633<br />
1980 2,361 5,025 7,544 7,077 6,721 2,755 16,375 3,000 3,610 9,765<br />
1981 2,382 5,163 7,782 7,364 6,840 2,865 16,180 2,922 3,640 9,619<br />
1982 2,317 5,209 7,848 7,526 6,874 2,924 15,982 2,884 3,640 9,458<br />
1983 2,253 5,334 8,039 7,781 7,078 3,021 16,011 2,915 3,662 9,434<br />
1984 2,398 5,553 8,464 8,211 7,489 3,186 16,159 2,943 3,734 9,482<br />
1985 2,437 5,815 8,871 8,679 7,869 3,366 16,533 3,014 3,832 9,687<br />
1986 2,445 6,128 9,211 9,086 8,156 3,523 16,838 3,044 3,893 9,901<br />
1987 2,507 6,385 9,608 9,543 8,446 3,699 17,156 3,089 3,967 10,100<br />
1988 2,585 6,500 10,090 10,096 8,778 3,907 17,540 3,124 4,076 10,339<br />
1989 2,622 6,562 10,555 10,652 9,062 4,116 17,927 3,136 4,182 10,609<br />
1990 2,688 6,614 10,848 11,024 9,288 4,261 18,415 3,196 4,305 10,914<br />
1991 2,677 6,561 10,714 11,556 9,256 4,249 18,545 3,110 4,355 11,081<br />
1992 2,641 6,559 10,970 11,948 9,437 4,240 18,787 3,111 4,408 11,267<br />
1993 2,668 6,742 11,495 12,362 9,732 4,350 18,989 3,063 4,488 11,438<br />
1994 2,738 6,910 12,174 12,872 10,100 4,428 19,275 3,018 4,576 11,682<br />
1995 2,843 6,866 12,844 13,360 10,501 4,572 19,432 2,949 4,635 11,849<br />
1996 2,940 7,018 13,462 13,761 10,777 4,690 19,539 2,877 4,606 12,056<br />
1997 3,084 7,255 14,335 14,185 11,018 4,825 19,664 2,806 4,582 12,276<br />
1998 3,218 7,565 15,147 14,570 11,232 4,976 19,909 2,772 4,612 12,525<br />
1999 3,419 7,753 15,957 14,939 11,543 5,087 20,307 2,769 4,709 12,829<br />
2000 3,630 7,783 16,666 15,252 11,862 5,168 20,790 2,865 4,786 13,139<br />
2001 3,629 7,900 16,476 15,814 12,036 5,258 21,118 2,764 4,905 13,449<br />
2002 3,395 7,956 15,976 16,398 11,986 5,372 21,513 2,766 5,029 13,718<br />
2003 3,188 8,078 15,987 16,835 12,173 5,401 21,583 2,761 5,002 13,820<br />
2004 3,118 8,105 16,394 17,230 12,493 5,409 21,621 2,730 4,982 13,909<br />
2005 3,061 8,197 16,954 17,676 12,816 5,395 21,804 2,732 5,032 14,041<br />
2006 3,038 8,367 17,566 18,154 13,110 5,438 21,974 2,732 5,075 14,167<br />
2007 3,032 8,348 17,942 18,676 13,427 5,494 22,218 2,734 5,122 14,362<br />
2008 2,984 8,206 17,735 19,228 13,436 5,515 22,509 2,762 5,177 14,571<br />
2009 2,804 7,838 16,579 19,630 13,077 5,367 22,555 2,832 5,169 14,554<br />
2010 2,707 7,695 16,728 19,975 13,049 5,331 22,490 2,977 5,137 14,376<br />
2011 2,674 7,697 17,332 20,318 13,353 5,360 22,086 2,859 5,078 14,150<br />
2012 2,676 7,784 17,932 20,769 13,768 5,430 21,920 2,820 5,055 14,045<br />
2013 2,706 7,886 18,515 21,086 14,254 5,483 21,853 2,769 5,046 14,037<br />
2014 2,726 7,977 19,062 21,439 14,696 5,567 21,882 2,733 5,064 14,084<br />
2015 p 2,750 8,124 19,672 22,055 15,128 5,625 22,007 2,754 5,103 14,150<br />
2014: Jan 2,721 7,915 18,770 21,220 14,494 5,534 21,807 2,733 5,048 14,026<br />
Feb 2,716 7,931 18,831 21,248 14,512 5,535 21,817 2,730 5,055 14,032<br />
Mar 2,724 7,933 18,878 21,290 14,561 5,552 21,828 2,728 5,054 14,046<br />
Apr 2,723 7,942 18,942 21,312 14,605 5,564 21,856 2,726 5,058 14,072<br />
May 2,717 7,951 18,981 21,367 14,662 5,566 21,854 2,726 5,058 14,070<br />
June 2,723 7,967 19,047 21,408 14,693 5,562 21,893 2,729 5,063 14,101<br />
July 2,728 7,981 19,093 21,449 14,714 5,565 21,881 2,730 5,061 14,090<br />
Aug 2,737 7,994 19,148 21,501 14,735 5,579 21,868 2,733 5,048 14,087<br />
Sept 2,735 8,008 19,199 21,551 14,771 5,574 21,917 2,735 5,069 14,113<br />
Oct 2,729 8,014 19,227 21,578 14,818 5,579 21,927 2,735 5,079 14,113<br />
Nov 2,732 8,033 19,292 21,628 14,856 5,592 21,934 2,742 5,080 14,112<br />
Dec 2,733 8,041 19,360 21,677 14,901 5,595 21,947 2,746 5,088 14,113<br />
2015: Jan 2,734 8,061 19,370 21,731 14,924 5,599 21,954 2,743 5,092 14,119<br />
Feb 2,738 8,070 19,409 21,790 14,989 5,607 21,967 2,747 5,096 14,124<br />
Mar 2,735 8,082 19,436 21,828 14,989 5,605 21,961 2,747 5,094 14,120<br />
Apr 2,745 8,089 19,505 21,905 15,010 5,614 21,971 2,750 5,096 14,125<br />
May 2,747 8,098 19,585 21,962 15,059 5,622 21,988 2,752 5,096 14,140<br />
June 2,751 8,117 19,661 22,017 15,089 5,619 21,990 2,752 5,099 14,139<br />
July 2,756 8,137 19,707 22,075 15,125 5,631 22,022 2,751 5,098 14,173<br />
Aug 2,753 8,150 19,742 22,137 15,158 5,622 22,049 2,753 5,106 14,190<br />
Sept 2,766 8,153 19,782 22,192 15,208 5,626 22,036 2,754 5,113 14,169<br />
Oct 2,771 8,164 19,873 22,270 15,261 5,637 22,027 2,752 5,114 14,161<br />
Nov 2,753 8,182 19,921 22,315 15,307 5,648 22,028 2,758 5,110 14,160<br />
Dec p 2,761 8,192 19,981 22,369 15,338 5,660 22,039 2,766 5,109 14,164<br />
Note (cont’d): employed when they are not at work because of industrial disputes, bad weather, etc., even if they are not paid for the time off; which are<br />
based on a sample of the working-age population; and which count persons only once—as employed, unemployed, or not in the labor force. In the data shown<br />
here, persons who work at more than one job are counted each time they appear on a payroll.<br />
Establishment data for employment, hours, and earnings are classified based on the 2012 North American Industry Classification System (NAICS).<br />
For further description and details see Employment and Earnings.<br />
Source: Department of Labor (Bureau of Labor Statistics).<br />
Labor Market Indicators | 417