Table B–8. New private housing units started, authorized, and completed and houses sold, 1972–2015 [Thousands; monthly data at seasonally adjusted annual rates] Year or month Total Type of structure Type of structure New housing units completed 1 unit 2 to 4 units 2 5 units or more Total 1 unit 2 to 4 units 5 units or more New houses sold 1972 2,356.6 1,309.2 141.2 906.2 2,218.9 1,033.1 148.6 1,037.2 2,003.9 718 1973 2,045.3 1,132.0 118.2 795.0 1,819.5 882.1 117.0 820.5 2,100.5 634 1974 1,337.7 888.1 68.0 381.6 1,074.4 643.8 64.4 366.2 1,728.5 519 1975 1,160.4 892.2 64.0 204.3 939.2 675.5 63.8 199.8 1,317.2 549 1976 1,537.5 1,162.4 85.8 289.2 1,296.2 893.6 93.1 309.5 1,377.2 646 1977 1,987.1 1,450.9 121.7 414.4 1,690.0 1,126.1 121.3 442.7 1,657.1 819 1978 2,020.3 1,433.3 125.1 462.0 1,800.5 1,182.6 130.6 487.3 1,867.5 817 1979 1,745.1 1,194.1 122.0 429.0 1,551.8 981.5 125.4 444.8 1,870.8 709 1980 1,292.2 852.2 109.5 330.5 1,190.6 710.4 114.5 365.7 1,501.6 545 1981 1,084.2 705.4 91.2 287.7 985.5 564.3 101.8 319.4 1,265.7 436 1982 1,062.2 662.6 80.1 319.6 1,000.5 546.4 88.3 365.8 1,005.5 412 1983 1,703.0 1,067.6 113.5 522.0 1,605.2 901.5 133.7 570.1 1,390.3 623 1984 1,749.5 1,084.2 121.4 543.9 1,681.8 922.4 142.6 616.8 1,652.2 639 1985 1,741.8 1,072.4 93.5 576.0 1,733.3 956.6 120.1 656.6 1,703.3 688 1986 1,805.4 1,179.4 84.0 542.0 1,769.4 1,077.6 108.4 583.5 1,756.4 750 1987 1,620.5 1,146.4 65.1 408.7 1,534.8 1,024.4 89.3 421.1 1,668.8 671 1988 1,488.1 1,081.3 58.7 348.0 1,455.6 993.8 75.7 386.1 1,529.8 676 1989 1,376.1 1,003.3 55.3 317.6 1,338.4 931.7 66.9 339.8 1,422.8 650 1990 1,192.7 894.8 37.6 260.4 1,110.8 793.9 54.3 262.6 1,308.0 534 1991 1,013.9 840.4 35.6 137.9 948.8 753.5 43.1 152.1 1,090.8 509 1992 1,199.7 1,029.9 30.9 139.0 1,094.9 910.7 45.8 138.4 1,157.5 610 1993 1,287.6 1,125.7 29.4 132.6 1,199.1 986.5 52.4 160.2 1,192.7 666 1994 1,457.0 1,198.4 35.2 223.5 1,371.6 1,068.5 62.2 241.0 1,346.9 670 1995 1,354.1 1,076.2 33.8 244.1 1,332.5 997.3 63.8 271.5 1,312.6 667 1996 1,476.8 1,160.9 45.3 270.8 1,425.6 1,069.5 65.8 290.3 1,412.9 757 1997 1,474.0 1,133.7 44.5 295.8 1,441.1 1,062.4 68.4 310.3 1,400.5 804 1998 1,616.9 1,271.4 42.6 302.9 1,612.3 1,187.6 69.2 355.5 1,474.2 886 1999 1,640.9 1,302.4 31.9 306.6 1,663.5 1,246.7 65.8 351.1 1,604.9 880 2000 1,568.7 1,230.9 38.7 299.1 1,592.3 1,198.1 64.9 329.3 1,573.7 877 2001 1,602.7 1,273.3 36.6 292.8 1,636.7 1,235.6 66.0 335.2 1,570.8 908 2002 1,704.9 1,358.6 38.5 307.9 1,747.7 1,332.6 73.7 341.4 1,648.4 973 2003 1,847.7 1,499.0 33.5 315.2 1,889.2 1,460.9 82.5 345.8 1,678.7 1,086 2004 1,955.8 1,610.5 42.3 303.0 2,070.1 1,613.4 90.4 366.2 1,841.9 1,203 2005 2,068.3 1,715.8 41.1 311.4 2,155.3 1,682.0 84.0 389.3 1,931.4 1,283 2006 1,800.9 1,465.4 42.7 292.8 1,838.9 1,378.2 76.6 384.1 1,979.4 1,051 2007 1,355.0 1,046.0 31.7 277.3 1,398.4 979.9 59.6 359.0 1,502.8 776 2008 905.5 622.0 17.5 266.0 905.4 575.6 34.4 295.4 1,119.7 485 2009 554.0 445.1 11.6 97.3 583.0 441.1 20.7 121.1 794.4 375 2010 586.9 471.2 11.4 104.3 604.6 447.3 22.0 135.3 651.7 323 2011 608.8 430.6 10.9 167.3 624.1 418.5 21.6 184.0 584.9 306 2012 780.6 535.3 11.4 233.9 829.7 518.7 25.9 285.1 649.2 368 2013 924.9 617.6 13.6 293.7 990.8 620.8 29.0 341.1 764.4 429 2014 1,003.3 647.9 13.7 341.7 1,052.1 640.3 29.9 382.0 883.8 437 2015 p 1,111.2 715.3 11.5 384.4 1,178.1 690.1 32.4 455.6 965.7 501 2014: Jan 888 577 303 1,002 621 30 351 847 446 Feb 951 604 336 1,030 613 24 393 872 417 Mar 963 649 300 1,061 622 29 410 911 410 Apr 1,039 639 391 1,074 622 27 425 826 410 May 986 637 340 1,017 626 29 362 903 457 June 927 597 307 1,033 648 38 347 797 408 July 1,095 657 422 1,041 640 30 371 861 403 Aug 966 643 306 1,040 643 35 362 905 454 Sept 1,026 661 353 1,053 653 26 374 948 459 Oct 1,079 705 357 1,120 652 32 436 917 472 Nov 1,007 670 328 1,079 663 28 388 867 449 Dec 1,080 724 336 1,077 685 24 368 939 495 2015: Jan 1,080 706 368 1,059 657 27 375 975 521 Feb 900 600 292 1,098 626 28 444 865 545 Mar 954 623 311 1,038 642 26 370 806 485 Apr 1,190 735 436 1,140 666 32 442 999 508 May 1,072 697 366 1,250 681 34 535 1,010 513 June 1,211 687 510 1,337 692 34 611 959 469 July 1,152 759 382 1,130 680 28 422 995 500 Aug 1,116 734 376 1,161 699 30 432 959 507 Sept 1,207 741 455 1,105 694 37 374 1,019 457 Oct 1,071 715 344 1,161 715 34 412 983 482 Nov p 1,179 794 378 1,282 727 29 526 959 491 Dec p 1,149 768 365 1,204 732 35 437 1,013 544 1 Authorized by issuance of local building permits in permit-issuing places: 20,100 places beginning with 2014; 19,300 for 2004–2013; 19,000 for 1994–2003; 17,000 for 1984–93; 16,000 for 1978–83; and 14,000 for 1972–77. 2 Monthly data do not meet publication standards because tests for identifiable and stable seasonality do not meet reliability standards. Note: One-unit estimates prior to 1999, for new housing units started and completed and for new houses sold, include an upward adjustment of 3.3 percent to account for structures in permit-issuing areas that did not have permit authorization. Source: Department of Commerce (Bureau of the Census). GDP, Income, Prices, and Selected Indicators | 409
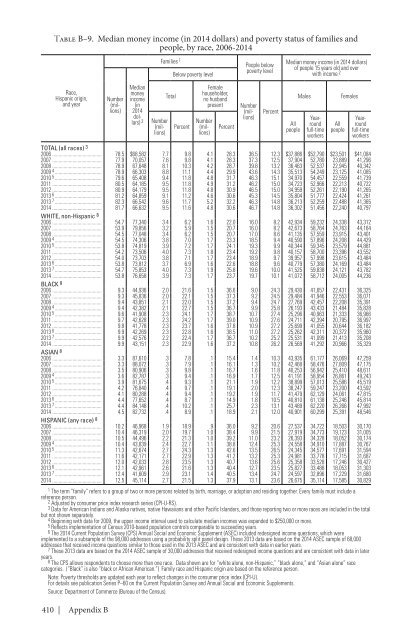
Table B–9. Median money income (in 2014 dollars) and poverty status of families and people, by race, 2006-2014 Families 1 Below poverty level People below poverty level Median money income (in 2014 dollars) of people 15 years old and over with income 2 Race, Hispanic origin, and year 410 | Appendix B Number (millions) Median money income (in 2014 dollars) 2 Number (millions) Total Percent Female householder, no husband present Percent Number (millions) Percent All people Males Number (millions) Yearround full-time workers All people Females Yearround full-time workers TOTAL (all races) 3 2006 78.5 $68,582 7.7 9.8 4.1 28.3 36.5 12.3 $37,886 $52,790 $23,501 $41,084 2007 77.9 70,057 7.6 9.8 4.1 28.3 37.3 12.5 37,904 52,780 23,889 41,296 2008 78.9 67,648 8.1 10.3 4.2 28.7 39.8 13.2 36,463 52,537 22,945 40,342 2009 4 78.9 66,303 8.8 11.1 4.4 29.9 43.6 14.3 35,513 54,249 23,125 41,085 2010 5 79.6 65,408 9.4 11.8 4.8 31.7 46.3 15.1 34,970 54,457 22,559 41,739 2011 80.5 64,185 9.5 11.8 4.9 31.2 46.2 15.0 34,723 52,966 22,213 40,722 2012 80.9 64,179 9.5 11.8 4.8 30.9 46.5 15.0 34,959 52,261 22,190 41,265 2013 6 81.2 64,859 9.1 11.2 4.6 30.6 45.3 14.5 35,804 51,777 22,424 41,261 2013 7 82.3 66,542 9.6 11.7 5.2 32.2 46.3 14.8 36,213 52,259 22,488 41,365 2014 81.7 66,632 9.5 11.6 4.8 30.6 46.7 14.8 36,302 51,456 22,240 40,797 WHITE, non-Hispanic 8 2006 54.7 77,340 3.4 6.2 1.6 22.0 16.0 8.2 42,934 59,232 24,338 43,312 2007 53.9 79,856 3.2 5.9 1.5 20.7 16.0 8.2 42,673 58,764 24,763 44,164 2008 54.5 77,048 3.4 6.2 1.5 20.7 17.0 8.6 41,135 57,559 23,915 43,401 2009 4 54.5 74,306 3.8 7.0 1.7 23.3 18.5 9.4 40,590 57,896 24,208 44,429 2010 5 53.8 74,819 3.9 7.2 1.7 24.1 19.3 9.9 40,344 59,345 23,579 44,881 2011 54.2 73,506 4.0 7.3 1.8 23.4 19.2 9.8 40,157 58,700 23,396 43,552 2012 54.0 73,703 3.8 7.1 1.7 23.4 18.9 9.7 39,957 57,998 23,615 43,484 2013 6 53.8 73,812 3.7 6.9 1.6 22.6 18.8 9.6 40,779 57,380 24,169 43,484 2013 7 54.7 75,853 4.0 7.3 1.9 25.8 19.6 10.0 41,525 59,838 24,121 43,782 2014 53.8 76,658 3.9 7.3 1.7 23.7 19.7 10.1 41,072 58,712 24,005 44,236 BLACK 8 2006 9.3 44,936 2.0 21.6 1.5 36.6 9.0 24.3 29,430 41,657 22,431 36,325 2007 9.3 45,836 2.0 22.1 1.5 37.3 9.2 24.5 29,484 41,946 22,553 36,071 2008 9.4 43,851 2.1 22.0 1.5 37.2 9.4 24.7 27,769 42,457 22,208 35,391 2009 4 9.4 42,382 2.1 22.7 1.5 36.7 9.9 25.8 26,193 43,433 21,484 35,828 2010 5 9.6 41,908 2.3 24.1 1.7 38.7 10.7 27.4 25,296 40,963 21,333 36,966 2011 9.7 42,628 2.3 24.2 1.7 39.0 10.9 27.6 24,711 42,394 20,795 36,997 2012 9.8 41,778 2.3 23.7 1.6 37.8 10.9 27.2 25,699 41,055 20,644 36,182 2013 6 9.9 42,269 2.3 22.8 1.6 38.5 11.0 27.2 25,262 42,311 20,372 35,960 2013 7 9.9 42,576 2.2 22.4 1.7 36.7 10.2 25.2 25,531 41,099 21,413 35,208 2014 9.9 43,151 2.3 22.9 1.6 37.2 10.8 26.2 26,569 41,292 20,966 35,329 ASIAN 8 2006 3.3 87,610 .3 7.8 .1 15.4 1.4 10.3 43,935 61,177 26,069 47,259 2007 3.3 88,072 .3 7.9 .1 16.1 1.3 10.2 42,468 58,476 27,809 47,175 2008 3.5 80,906 .3 9.8 .1 16.7 1.6 11.8 40,253 56,942 25,410 48,611 2009 4 3.6 82,787 .3 9.4 .1 16.9 1.7 12.5 41,191 58,954 26,861 49,243 2010 5 3.9 81,675 .4 9.3 .1 21.1 1.9 12.2 38,899 57,013 25,586 45,519 2011 4.2 76,840 .4 9.7 .1 19.1 2.0 12.3 38,247 59,247 23,200 43,592 2012 4.1 80,288 .4 9.4 .1 19.2 1.9 11.7 41,479 62,129 24,061 47,815 2013 6 4.4 77,652 .4 8.7 .1 14.9 1.8 10.5 40,810 61,138 25,246 45,814 2013 7 4.4 84,148 .4 10.2 .1 25.7 2.3 13.1 43,489 62,220 26,266 47,992 2014 4.5 82,732 .4 8.9 .1 18.9 2.1 12.0 40,901 60,299 25,391 48,546 HISPANIC (any race) 8 2006 10.2 46,968 1.9 18.9 .9 36.0 9.2 20.6 27,537 34,722 18,503 30,170 2007 10.4 46,319 2.0 19.7 1.0 38.4 9.9 21.5 27,919 34,773 19,123 31,005 2008 10.5 44,496 2.2 21.3 1.0 39.2 11.0 23.2 26,393 34,328 18,052 30,174 2009 4 10.4 43,839 2.4 22.7 1.1 38.8 12.4 25.3 24,558 34,910 17,887 30,767 2010 5 11.3 42,674 2.7 24.3 1.3 42.6 13.5 26.5 24,345 34,577 17,691 31,594 2011 11.6 42,171 2.7 22.9 1.3 41.2 13.2 25.3 24,981 33,778 17,715 31,687 2012 12.0 42,033 2.8 23.5 1.3 40.7 13.6 25.6 25,358 33,528 17,246 30,427 2013 6 12.1 42,961 2.6 21.6 1.3 40.4 12.7 23.5 25,827 33,488 18,053 31,303 2013 7 12.4 41,609 2.9 23.1 1.4 40.5 13.4 24.7 24,597 32,896 17,229 31,680 2014 12.5 45,114 2.7 21.5 1.3 37.9 13.1 23.6 26,675 35,114 17,585 30,829 1 The term “family” refers to a group of two or more persons related by birth, marriage, or adoption and residing together. Every family must include a reference person. 2 Adjusted by consumer price index research series (CPI-U-RS). 3 Data for American Indians and Alaska natives, native Hawaiians and other Pacific Islanders, and those reporting two or more races are included in the total but not shown separately. 4 Beginning with data for 2009, the upper income interval used to calculate median incomes was expanded to $250,000 or more. 5 Reflects implementation of Census 2010-based population controls comparable to succeeding years. 6 The 2014 Current Population Survey (CPS) Annual Social and Economic Supplement (ASEC) included redesigned income questions, which were implemented to a subsample of the 98,000 addresses using a probability split panel design. These 2013 data are based on the 2014 ASEC sample of 68,000 addresses that received income questions similar to those used in the 2013 ASEC and are consistent with data in earlier years. 7 These 2013 data are based on the 2014 ASEC sample of 30,000 addresses that received redesigned income questions and are consistent with data in later years. 8 The CPS allows respondents to choose more than one race. Data shown are for “white alone, non-Hispanic,” “black alone,” and “Asian alone” race categories. (“Black” is also “black or African American.”) Family race and Hispanic origin are based on the reference person. Note: Poverty thresholds are updated each year to reflect changes in the consumer price index (CPI-U). For details see publication Series P–60 on the Current Population Survey and Annual Social and Economic Supplements. Source: Department of Commerce (Bureau of the Census).
- Page 1 and 2:
ECONOMIC REPORT OF THE PRESIDENT To
- Page 4:
C O N T E N T S ECONOMIC REPORT OF
- Page 8 and 9:
economic report of the president To
- Page 10 and 11:
when a hardworking American loses h
- Page 12:
the annual report of the council of
- Page 16 and 17:
C O N T E N T S CHAPTER 1 INCLUSIVE
- Page 18 and 19:
CHAPTER 5 TECHNOLOGY AND INNOVATION
- Page 20 and 21:
APPENDIXES A. Report to the Preside
- Page 22 and 23:
3.4. Percent Gap Between Actual and
- Page 24 and 25:
6.6. Relationship between Output Gr
- Page 26 and 27:
C H A P T E R 1 INCLUSIVE GROWTH IN
- Page 28 and 29:
To promote inclusive growth, both c
- Page 30 and 31:
Percent 20 15 Figure 1-1 Share of I
- Page 32 and 33:
Table 1-1 Increase in Income Share
- Page 34 and 35:
Figure 1-3 Distribution of Househol
- Page 36 and 37:
narrows the pool of human capital t
- Page 38 and 39:
over the past several decades has b
- Page 40 and 41:
Figure 1-6a The "Great Gatsby Curve
- Page 42 and 43:
Figure 1-7 Change in Employment by
- Page 44 and 45:
and sellers—consumer and producer
- Page 46 and 47:
Percent 15 10 Figure 1-9 Corporate
- Page 48 and 49:
Percent 30 Figure 1-11 Share of Wor
- Page 50 and 51:
Figure 1-12 Real Construction Costs
- Page 52 and 53:
promoting equality of opportunity;
- Page 54 and 55:
the division of rents, they can red
- Page 56 and 57:
C H A P T E R 2 THE YEAR IN REVIEW
- Page 58 and 59:
cold weather.1 The economy rebounde
- Page 60 and 61:
Box 2-1: Impact of Oil Price Declin
- Page 62 and 63:
Roughly speaking, the decline in th
- Page 64 and 65:
Percent of GDP 10 Figure 2-3 Federa
- Page 66 and 67:
Figure 2-5 Government Purchases as
- Page 68 and 69:
13 percent of GDP. Until 1990, Stat
- Page 70 and 71:
of new purchases.2 The increase in
- Page 72 and 73:
Figure 2-8 Actual and Consensus For
- Page 74 and 75:
Figure 2-10 Rates of Part-Time Work
- Page 76 and 77:
less than a tenth of the overall de
- Page 78 and 79:
Business fixed investment grew 3.1
- Page 80 and 81:
Percent 10 Figure 2-14 Personal Sav
- Page 82 and 83:
BEA revises the official statistics
- Page 84 and 85:
Index* 100 Figure 2-16 Real Income
- Page 86 and 87:
Box 2-5: Are Official Estimates of
- Page 88 and 89:
of consumer surplus, which should,
- Page 90 and 91:
Figure 2-19 National House Price In
- Page 92 and 93:
Box 2-6: Constraints on Housing Sup
- Page 94 and 95:
and also was estimated in recent re
- Page 96 and 97:
market. Nevertheless, the construct
- Page 98 and 99:
Figure 2-23 Net Investment as a Sha
- Page 100 and 101:
Percent 80 Figure 2-25 Total Payout
- Page 102 and 103:
Figure 2-28 Foreign Real GDP and U.
- Page 104 and 105:
Figure 2-30 Sources of Productivity
- Page 106 and 107:
Figure 2-32 Nominal Wage Growth Ove
- Page 108 and 109:
Figure 2-35 Long-Term Inflation Exp
- Page 110 and 111:
Percent 18 Figure 2-36 Nominal 10-Y
- Page 112 and 113:
Table 2-1 Selected Interest Rates,
- Page 114 and 115:
are close to those projected by the
- Page 116 and 117:
International Economics (Petri and
- Page 118 and 119:
History Forecast 1953:Q2 to 2015:Q3
- Page 120 and 121:
inflation up to 2007 and then expec
- Page 122:
Upside and Downside Forecast Risks.
- Page 125 and 126:
earlier forecasts. Figure 3-1 shows
- Page 127 and 128:
Real GDP/WAP Growth 2011-2014 Figur
- Page 129 and 130:
economists would expect capital dee
- Page 131 and 132:
Figure 3-i Actual and Forecasted Wo
- Page 133 and 134:
affected the demographic trajectory
- Page 135 and 136:
over the first three quarters of 20
- Page 137 and 138:
Percentage Points 35 30 Figure 3-7
- Page 139 and 140:
the President for a discussion of t
- Page 141 and 142:
Box 3-2: Market Volatility in the S
- Page 143 and 144:
potential for rapid spillovers betw
- Page 145 and 146:
absorb unexpectedly high losses. In
- Page 147 and 148:
Box 3-3: Commodity Prices and Infla
- Page 149 and 150:
In November 2015, the IMF voted to
- Page 151 and 152:
Billions of U.S. Dollars 250 200 15
- Page 153 and 154:
U.S. exports are 12.5 percent of th
- Page 155 and 156:
Box 3-4: The Importance of the Tran
- Page 157 and 158:
The challenging environment for U.S
- Page 159 and 160:
child’s environment. Despite the
- Page 161 and 162:
and Rossin-Slater 2015).5 These adv
- Page 163 and 164:
Figure 4-2 Official Poverty Rate fo
- Page 165 and 166:
Figure 4-3 Likelihood of Scoring Ve
- Page 167 and 168:
Percent 100 90 80 70 60 50 40 30 20
- Page 169 and 170:
Figure 4-7 Achievement Gap is Large
- Page 171 and 172:
Hours per Week 24 22 20 Figure 4-9
- Page 173 and 174:
Percent 65 Figure 4-11 Preschool En
- Page 175 and 176:
Box 4-1: Gender Differences in Earl
- Page 177 and 178:
Card and Rothstein 2007; Dickerson
- Page 179 and 180:
depend on how parents choose to inv
- Page 181 and 182:
y many factors, which makes it diff
- Page 183 and 184:
Box 4-3: Federal Early Childhood Pr
- Page 185 and 186:
program served over 45 million Amer
- Page 187 and 188:
Reauthorization Act of 2015, signed
- Page 189 and 190:
document that desegregation of hosp
- Page 191 and 192:
to alleviate hunger by supplementin
- Page 193 and 194:
adulthood (Hoynes, Schanzenbach, an
- Page 195 and 196:
of preschoolers support their child
- Page 197 and 198:
program and up to 15 years after co
- Page 199 and 200:
a longer period than is true of mos
- Page 201 and 202:
to be higher today than in the past
- Page 203 and 204:
Figure 4-18 Most Early Childhood Pr
- Page 205 and 206:
the preschool programs in Georgia a
- Page 207 and 208:
test scores by 6 to 9 percent of a
- Page 209 and 210:
Figure 4-20 Increase in Probability
- Page 211 and 212:
increased earnings by 31 percent (F
- Page 213 and 214:
Figure 5-1 Labor Productivity Growt
- Page 215 and 216:
Competition and Dynamism Play a Cri
- Page 217 and 218:
adopts pre-existing technology or k
- Page 219 and 220:
Figure 5-2 Quantity and Volume of V
- Page 221 and 222:
Box 5-2: Occupational Licensing One
- Page 223 and 224:
in consumer welfare as they erode t
- Page 225 and 226:
Finally, some workers may acquire s
- Page 227 and 228:
Box 5-3: Major Research Initiatives
- Page 229 and 230:
Figure 5-5 Federal and Nonfederal R
- Page 231 and 232:
Figure 5-7 Federal Research and Dev
- Page 233 and 234:
Figure 5-10 Percent of Patent Appli
- Page 235 and 236:
percent of all cases in 2009 to ove
- Page 237 and 238:
(Bloom, Sadun, and Van Reenen 2012)
- Page 239 and 240:
Figure 5-12 Estimated Annual Shipme
- Page 241 and 242:
was relatively flat through the 200
- Page 243 and 244:
In contrast, recent papers by Autor
- Page 245 and 246:
services, such as 4G LTE. At the sa
- Page 247 and 248:
Box 5-5: The On-Demand Economy “O
- Page 249 and 250:
vision of services that may not hav
- Page 251 and 252:
Figure 5-17 Household Income and Ho
- Page 253 and 254:
about half since ConnectED was laun
- Page 256 and 257:
C H A P T E R 6 THE ECONOMIC BENEFI
- Page 258 and 259:
enefits to a wide set of consumers
- Page 260 and 261:
Figure 6-1 Composition of Public Sp
- Page 262 and 263:
Age, Years 29 27 Figure 6-3 Average
- Page 264 and 265:
Type CAN FRA DEU ITA JPN GBR USA 20
- Page 266 and 267:
Box 6-1: Clean Energy and Transport
- Page 268 and 269:
Industry Government Investment Dire
- Page 270 and 271:
infrastructure investment is crucia
- Page 272 and 273:
Box 6-2: Elasticity of Output to Pu
- Page 274 and 275:
and output ignore potential inter-t
- Page 276 and 277:
Thus, ideas are exchanged, workers
- Page 278 and 279:
kilometers of road) in 1983 resulte
- Page 280 and 281:
Prospects for Increased Infrastruct
- Page 282 and 283:
Figure 6-6 Relationship between Out
- Page 284 and 285:
there is a clear demand for an infr
- Page 286 and 287:
user fees or shadow tolls.11 Throug
- Page 288 and 289:
to transportation facilities caused
- Page 290 and 291:
Tax-Exempt Bonds Transportation inf
- Page 292 and 293:
Recent Legislation In December 2015
- Page 294 and 295:
enefit freight movements. The Act a
- Page 296 and 297:
C H A P T E R 7 THE 70 TH ANNIVERSA
- Page 298 and 299:
and composition of the labor force,
- Page 300 and 301:
it, “[t]he CEA and its chairman h
- Page 302 and 303:
jected reductions in the deficit. I
- Page 304 and 305:
example, the Environmental Protecti
- Page 306 and 307:
Keyserling and the Council particip
- Page 308 and 309:
Countercyclical Policy in Other Adm
- Page 310 and 311:
In designing the Recovery Act, one
- Page 312 and 313:
incorporating risk and discounting
- Page 314 and 315:
and Freddie had lots of friends in
- Page 316 and 317:
(USEC). USEC was responsible for pr
- Page 318 and 319:
can be reported to him as the perce
- Page 320 and 321:
By contrast, Keyserling had activel
- Page 322 and 323:
goals of the government in their ar
- Page 324 and 325:
Gather, Analyze, and Interpret Info
- Page 326 and 327:
the unemployment insurance system w
- Page 328 and 329:
an informational basis for appropri
- Page 330 and 331:
had experience working in governmen
- Page 332 and 333:
emained. I joined forces with Budge
- Page 334:
Of course, relying on short-term ac
- Page 337 and 338:
Carson, Ann. 2015. “Prisoners in
- Page 339 and 340:
Kleiner, Morris M. and Alan B. Krue
- Page 341 and 342:
Congressional Budget Office (CBO).
- Page 343 and 344:
Kocin, Paul J. and Louis Uccellini.
- Page 345 and 346:
Fajgelbaum, Pablo and Amit Khandelw
- Page 347 and 348:
World Bank. 2016. “Global Economi
- Page 349 and 350:
Belfield, Clive R., Milagros Nores,
- Page 351 and 352:
Campbell, Jennifer A., Rebekah J. W
- Page 353 and 354:
Council of Economic Advisers. 2014.
- Page 355 and 356:
Eissa, Nada and Jeffrey B. Liebman.
- Page 357 and 358:
Hastings, Justine S. and Ebonya Was
- Page 359 and 360:
Kalil, Ariel, Rebecca Ryan, and Mic
- Page 361 and 362:
Maxfield, Michelle. 2013. “The Ef
- Page 363 and 364: Olds, David, John Eckenrode, Charle
- Page 365 and 366: Solon, Gary. 1992. “Intergenerati
- Page 367 and 368: Wherry, Laura R., Sarah Miller, Rob
- Page 369 and 370: Bloom, Nicholas, Mark Schankerman,
- Page 371 and 372: Graham, Stuart JH, Cheryl Grim, Tar
- Page 373 and 374: Melitz, Marc J. 2003. “The Impact
- Page 375 and 376: ______. 2015. “Patent Assertions:
- Page 377 and 378: Congressional Budget Office. 2009.
- Page 379 and 380: Peshkin, David G., Todd E. Hoerner,
- Page 381 and 382: ______. 2001. Designing U.S. Econom
- Page 383 and 384: Krueger, Alan B. 2000. “Honest Br
- Page 385 and 386: Weidenbaum, Murray L. 1983. “An E
- Page 388 and 389: letter of transmittal Council of Ec
- Page 390: Council Members and Their Dates of
- Page 393 and 394: The Members of the Council Sandra E
- Page 395 and 396: In May, the Council issued a report
- Page 397 and 398: Nirupama S. Rao . . . . . . . . . .
- Page 399 and 400: Jessica Schumer resigned from her p
- Page 402 and 403: C O N T E N T S GDP, INCOME, PRICES
- Page 404 and 405: General Notes Detail in these table
- Page 406 and 407: Table B-1. Percent changes in real
- Page 408 and 409: Table B-2. Gross domestic product,
- Page 410 and 411: Table B-4. Growth rates in real gro
- Page 412 and 413: Year or quarter Total Table B-6. Co
- Page 416 and 417: Table B-10. Changes in consumer pri
- Page 418 and 419: Table B-11. Civilian labor force, 1
- Page 420 and 421: Year or month Table B-13. Unemploym
- Page 422 and 423: Table B-14. Employees on nonagricul
- Page 424 and 425: Year or quarter Table B-16. Product
- Page 426 and 427: Table B-18. Federal receipts, outla
- Page 428 and 429: Table B-20. Federal receipts, outla
- Page 430 and 431: Table B-22. State and local governm
- Page 432 and 433: End of month Table B-24. Estimated
- Page 434 and 435: Table B-25. Bond yields and interes