

ECONOMIC REPORT OF THE PRESIDENT
YFksc
YFksc

Create successful ePaper yourself
Turn your PDF publications into a flip-book with our unique Google optimized e-Paper software.
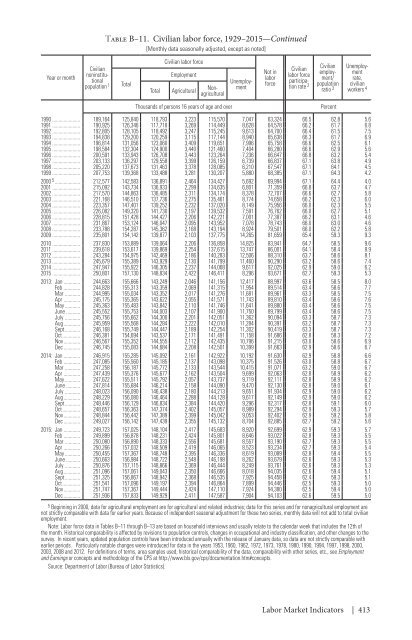
Table B–11. Civilian labor force, 1929–2015—Continued<br />
[Monthly data seasonally adjusted, except as noted]<br />
Year or month<br />
Civilian<br />
noninstitutional<br />
population 1<br />
Total<br />
Total<br />
Civilian labor force<br />
Employment<br />
Agricultural<br />
Unemployment<br />
Nonagricultural<br />
Not in<br />
labor<br />
force<br />
Civilian<br />
labor force<br />
participation<br />
rate 2<br />
Civilian<br />
employment/<br />
population<br />
ratio 3<br />
Unemployment<br />
rate,<br />
civilian<br />
workers 4<br />
Thousands of persons 16 years of age and over<br />
1990 189,164 125,840 118,793 3,223 115,570 7,047 63,324 66.5 62.8 5.6<br />
1991 190,925 126,346 117,718 3,269 114,449 8,628 64,578 66.2 61.7 6.8<br />
1992 192,805 128,105 118,492 3,247 115,245 9,613 64,700 66.4 61.5 7.5<br />
1993 194,838 129,200 120,259 3,115 117,144 8,940 65,638 66.3 61.7 6.9<br />
1994 196,814 131,056 123,060 3,409 119,651 7,996 65,758 66.6 62.5 6.1<br />
1995 198,584 132,304 124,900 3,440 121,460 7,404 66,280 66.6 62.9 5.6<br />
1996 200,591 133,943 126,708 3,443 123,264 7,236 66,647 66.8 63.2 5.4<br />
1997 203,133 136,297 129,558 3,399 126,159 6,739 66,837 67.1 63.8 4.9<br />
1998 205,220 137,673 131,463 3,378 128,085 6,210 67,547 67.1 64.1 4.5<br />
1999 207,753 139,368 133,488 3,281 130,207 5,880 68,385 67.1 64.3 4.2<br />
2000 5 212,577 142,583 136,891 2,464 134,427 5,692 69,994 67.1 64.4 4.0<br />
2001 215,092 143,734 136,933 2,299 134,635 6,801 71,359 66.8 63.7 4.7<br />
2002 217,570 144,863 136,485 2,311 134,174 8,378 72,707 66.6 62.7 5.8<br />
2003 221,168 146,510 137,736 2,275 135,461 8,774 74,658 66.2 62.3 6.0<br />
2004 223,357 147,401 139,252 2,232 137,020 8,149 75,956 66.0 62.3 5.5<br />
2005 226,082 149,320 141,730 2,197 139,532 7,591 76,762 66.0 62.7 5.1<br />
2006 228,815 151,428 144,427 2,206 142,221 7,001 77,387 66.2 63.1 4.6<br />
2007 231,867 153,124 146,047 2,095 143,952 7,078 78,743 66.0 63.0 4.6<br />
2008 233,788 154,287 145,362 2,168 143,194 8,924 79,501 66.0 62.2 5.8<br />
2009 235,801 154,142 139,877 2,103 137,775 14,265 81,659 65.4 59.3 9.3<br />
2010 237,830 153,889 139,064 2,206 136,858 14,825 83,941 64.7 58.5 9.6<br />
2011 239,618 153,617 139,869 2,254 137,615 13,747 86,001 64.1 58.4 8.9<br />
2012 243,284 154,975 142,469 2,186 140,283 12,506 88,310 63.7 58.6 8.1<br />
2013 245,679 155,389 143,929 2,130 141,799 11,460 90,290 63.2 58.6 7.4<br />
2014 247,947 155,922 146,305 2,237 144,068 9,617 92,025 62.9 59.0 6.2<br />
2015 250,801 157,130 148,834 2,422 146,411 8,296 93,671 62.7 59.3 5.3<br />
2013: Jan 244,663 155,666 143,249 2,046 141,156 12,417 88,997 63.6 58.5 8.0<br />
Feb 244,828 155,313 143,359 2,069 141,315 11,954 89,514 63.4 58.6 7.7<br />
Mar 244,995 155,034 143,352 2,017 141,276 11,681 89,961 63.3 58.5 7.5<br />
Apr 245,175 155,365 143,622 2,055 141,571 11,743 89,810 63.4 58.6 7.6<br />
May 245,363 155,483 143,842 2,110 141,746 11,641 89,880 63.4 58.6 7.5<br />
June 245,552 155,753 144,003 2,107 141,900 11,750 89,799 63.4 58.6 7.5<br />
July 245,756 155,662 144,300 2,201 142,051 11,362 90,094 63.3 58.7 7.3<br />
Aug 245,959 155,568 144,284 2,222 142,010 11,284 90,391 63.2 58.7 7.3<br />
Sept 246,168 155,749 144,447 2,189 142,254 11,302 90,419 63.3 58.7 7.3<br />
Oct 246,381 154,694 143,537 2,171 141,491 11,158 91,686 62.8 58.3 7.2<br />
Nov 246,567 155,352 144,555 2,112 142,435 10,796 91,215 63.0 58.6 6.9<br />
Dec 246,745 155,083 144,684 2,208 142,501 10,399 91,663 62.9 58.6 6.7<br />
2014: Jan 246,915 155,285 145,092 2,161 142,922 10,192 91,630 62.9 58.8 6.6<br />
Feb 247,085 155,560 145,185 2,137 143,098 10,375 91,526 63.0 58.8 6.7<br />
Mar 247,258 156,187 145,772 2,133 143,544 10,415 91,071 63.2 59.0 6.7<br />
Apr 247,439 155,376 145,677 2,162 143,504 9,699 92,063 62.8 58.9 6.2<br />
May 247,622 155,511 145,792 2,057 143,737 9,719 92,111 62.8 58.9 6.2<br />
June 247,814 155,684 146,214 2,158 144,090 9,470 92,130 62.8 59.0 6.1<br />
July 248,023 156,090 146,438 2,180 144,213 9,651 91,934 62.9 59.0 6.2<br />
Aug 248,229 156,080 146,464 2,288 144,128 9,617 92,149 62.9 59.0 6.2<br />
Sept 248,446 156,129 146,834 2,384 144,420 9,296 92,317 62.8 59.1 6.0<br />
Oct 248,657 156,363 147,374 2,402 145,057 8,989 92,294 62.9 59.3 5.7<br />
Nov 248,844 156,442 147,389 2,399 145,042 9,053 92,402 62.9 59.2 5.8<br />
Dec 249,027 156,142 147,439 2,355 145,132 8,704 92,885 62.7 59.2 5.6<br />
2015: Jan 249,723 157,025 148,104 2,417 145,683 8,920 92,699 62.9 59.3 5.7<br />
Feb 249,899 156,878 148,231 2,424 145,801 8,646 93,022 62.8 59.3 5.5<br />
Mar 250,080 156,890 148,333 2,556 145,681 8,557 93,190 62.7 59.3 5.5<br />
Apr 250,266 157,032 148,509 2,419 146,065 8,523 93,234 62.7 59.3 5.4<br />
May 250,455 157,367 148,748 2,395 146,336 8,619 93,089 62.8 59.4 5.5<br />
June 250,663 156,984 148,722 2,548 146,198 8,262 93,679 62.6 59.3 5.3<br />
July 250,876 157,115 148,866 2,369 146,444 8,249 93,761 62.6 59.3 5.3<br />
Aug 251,096 157,061 149,043 2,350 146,666 8,018 94,035 62.6 59.4 5.1<br />
Sept 251,325 156,867 148,942 2,368 146,535 7,925 94,458 62.4 59.3 5.1<br />
Oct 251,541 157,096 149,197 2,394 146,864 7,899 94,446 62.5 59.3 5.0<br />
Nov 251,747 157,367 149,444 2,424 147,110 7,924 94,380 62.5 59.4 5.0<br />
Dec 251,936 157,833 149,929 2,411 147,587 7,904 94,103 62.6 59.5 5.0<br />
5 Beginning in 2000, data for agricultural employment are for agricultural and related industries; data for this series and for nonagricultural employment are<br />
not strictly comparable with data for earlier years. Because of independent seasonal adjustment for these two series, monthly data will not add to total civilian<br />
employment.<br />
Note: Labor force data in Tables B–11 through B–13 are based on household interviews and usually relate to the calendar week that includes the 12th of<br />
the month. Historical comparability is affected by revisions to population controls, changes in occupational and industry classification, and other changes to the<br />
survey. In recent years, updated population controls have been introduced annually with the release of January data, so data are not strictly comparable with<br />
earlier periods. Particularly notable changes were introduced for data in the years 1953, 1960, 1962, 1972, 1973, 1978, 1980, 1990, 1994, 1997, 1998, 2000,<br />
2003, 2008 and 2012. For definitions of terms, area samples used, historical comparability of the data, comparability with other series, etc., see Employment<br />
and Earnings or concepts and methodology of the CPS at http://www.bls.gov/cps/documentation.htm#concepts.<br />
Source: Department of Labor (Bureau of Labor Statistics).<br />
Percent<br />
Labor Market Indicators | 413