MacroeconomicsI_working_version (1)

Create successful ePaper yourself
Turn your PDF publications into a flip-book with our unique Google optimized e-Paper software.
The Phillips Curve 99<br />
∆P/P<br />
∆W/W<br />
Price inflation (percent per year)<br />
8<br />
7<br />
6<br />
5<br />
4<br />
3<br />
2<br />
1<br />
Phillips curve<br />
10<br />
9<br />
8<br />
7<br />
6<br />
5<br />
4<br />
3<br />
Annual wage rise (percent per year)<br />
0<br />
2<br />
1 2 3 4 5 6 7 8 9 10<br />
Unemployment rate<br />
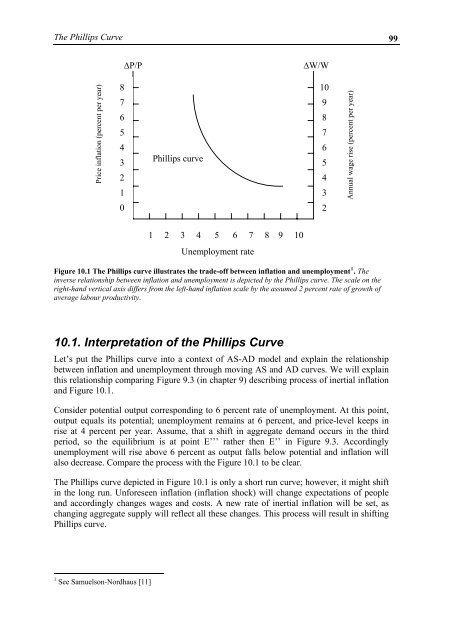
Figure 10.1 The Phillips curve illustrates the trade-off between inflation and unemployment 1 . The<br />
inverse relationship between inflation and unemployment is depicted by the Phillips curve. The scale on the<br />
right-hand vertical axis differs from the left-hand inflation scale by the assumed 2 percent rate of growth of<br />
average labour productivity.<br />
10.1. Interpretation of the Phillips Curve<br />
Let’s put the Phillips curve into a context of AS-AD model and explain the relationship<br />
between inflation and unemployment through moving AS and AD curves. We will explain<br />
this relationship comparing Figure 9.3 (in chapter 9) describing process of inertial inflation<br />
and Figure 10.1.<br />
Consider potential output corresponding to 6 percent rate of unemployment. At this point,<br />
output equals its potential; unemployment remains at 6 percent, and price-level keeps in<br />
rise at 4 percent per year. Assume, that a shift in aggregate demand occurs in the third<br />
period, so the equilibrium is at point E’’’ rather then E’’ in Figure 9.3. Accordingly<br />
unemployment will rise above 6 percent as output falls below potential and inflation will<br />
also decrease. Compare the process with the Figure 10.1 to be clear.<br />
The Phillips curve depicted in Figure 10.1 is only a short run curve; however, it might shift<br />
in the long run. Unforeseen inflation (inflation shock) will change expectations of people<br />
and accordingly changes wages and costs. A new rate of inertial inflation will be set, as<br />
changing aggregate supply will reflect all these changes. This process will result in shifting<br />
Phillips curve.<br />
1 See Samuelson-Nordhaus [11]