MacroeconomicsI_working_version (1)

Create successful ePaper yourself
Turn your PDF publications into a flip-book with our unique Google optimized e-Paper software.
26<br />
Chapter 3<br />
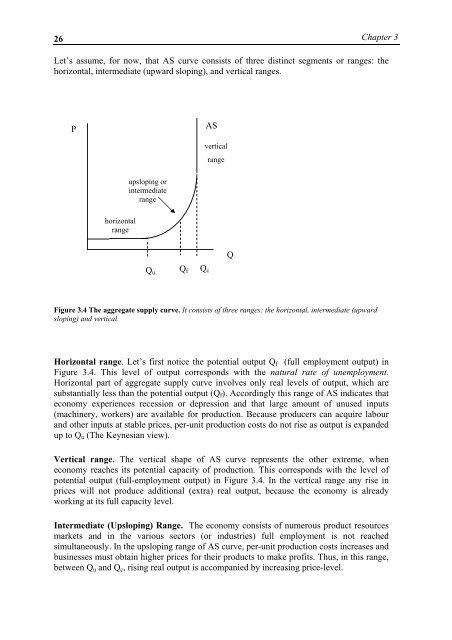
Let’s assume, for now, that AS curve consists of three distinct segments or ranges: the<br />
horizontal, intermediate (upward sloping), and vertical ranges.<br />
P<br />
AS<br />
vertical<br />
range<br />
upsloping or<br />
intermediate<br />
range<br />
horizontal<br />
range<br />
Q<br />
Q u<br />
Q f Q c<br />
Figure 3.4 The aggregate supply curve. It consists of three ranges: the horizontal, intermediate (upward<br />
sloping) and vertical.<br />
Horizontal range. Let’s first notice the potential output Q f (full employment output) in<br />
Figure 3.4. This level of output corresponds with the natural rate of unemployment.<br />
Horizontal part of aggregate supply curve involves only real levels of output, which are<br />
substantially less than the potential output (Q f ). Accordingly this range of AS indicates that<br />
economy experiences recession or depression and that large amount of unused inputs<br />
(machinery, workers) are available for production. Because producers can acquire labour<br />
and other inputs at stable prices, per-unit production costs do not rise as output is expanded<br />
up to Q u (The Keynesian view).<br />
Vertical range. The vertical shape of AS curve represents the other extreme, when<br />
economy reaches its potential capacity of production. This corresponds with the level of<br />
potential output (full-employment output) in Figure 3.4. In the vertical range any rise in<br />
prices will not produce additional (extra) real output, because the economy is already<br />
<strong>working</strong> at its full capacity level.<br />
Intermediate (Upsloping) Range. The economy consists of numerous product resources<br />
markets and in the various sectors (or industries) full employment is not reached<br />
simultaneously. In the upsloping range of AS curve, per-unit production costs increases and<br />
businesses must obtain higher prices for their products to make profits. Thus, in this range,<br />
between Q u and Q c , rising real output is accompanied by increasing price-level.