MacroeconomicsI_working_version (1)

You also want an ePaper? Increase the reach of your titles
YUMPU automatically turns print PDFs into web optimized ePapers that Google loves.
76<br />
Chapter 8<br />
S<br />
Real wage<br />
Labour Supply<br />
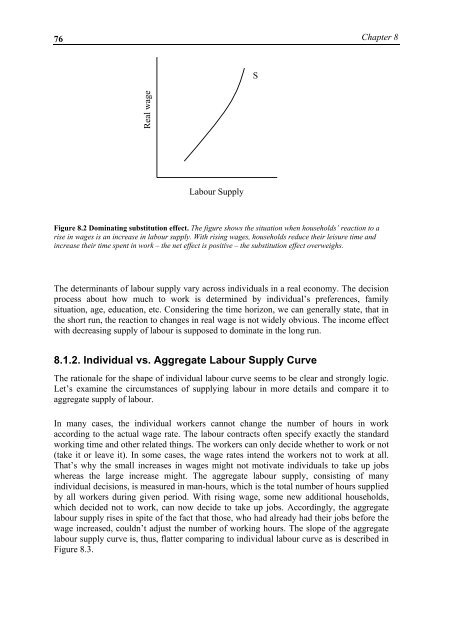
Figure 8.2 Dominating substitution effect. The figure shows the situation when households’ reaction to a<br />
rise in wages is an increase in labour supply. With rising wages, households reduce their leisure time and<br />
increase their time spent in work – the net effect is positive – the substitution effect overweighs.<br />
The determinants of labour supply vary across individuals in a real economy. The decision<br />
process about how much to work is determined by individual’s preferences, family<br />
situation, age, education, etc. Considering the time horizon, we can generally state, that in<br />
the short run, the reaction to changes in real wage is not widely obvious. The income effect<br />
with decreasing supply of labour is supposed to dominate in the long run.<br />
8.1.2. Individual vs. Aggregate Labour Supply Curve<br />
The rationale for the shape of individual labour curve seems to be clear and strongly logic.<br />
Let’s examine the circumstances of supplying labour in more details and compare it to<br />
aggregate supply of labour.<br />
In many cases, the individual workers cannot change the number of hours in work<br />
according to the actual wage rate. The labour contracts often specify exactly the standard<br />
<strong>working</strong> time and other related things. The workers can only decide whether to work or not<br />
(take it or leave it). In some cases, the wage rates intend the workers not to work at all.<br />
That’s why the small increases in wages might not motivate individuals to take up jobs<br />
whereas the large increase might. The aggregate labour supply, consisting of many<br />
individual decisions, is measured in man-hours, which is the total number of hours supplied<br />
by all workers during given period. With rising wage, some new additional households,<br />
which decided not to work, can now decide to take up jobs. Accordingly, the aggregate<br />
labour supply rises in spite of the fact that those, who had already had their jobs before the<br />
wage increased, couldn’t adjust the number of <strong>working</strong> hours. The slope of the aggregate<br />
labour supply curve is, thus, flatter comparing to individual labour curve as is described in<br />
Figure 8.3.