MacroeconomicsI_working_version (1)

You also want an ePaper? Increase the reach of your titles
YUMPU automatically turns print PDFs into web optimized ePapers that Google loves.
80<br />
Chapter 8<br />
Supply<br />
Real wage<br />
w<br />
A<br />
Demand<br />
L<br />
L‘<br />
Labour hours<br />
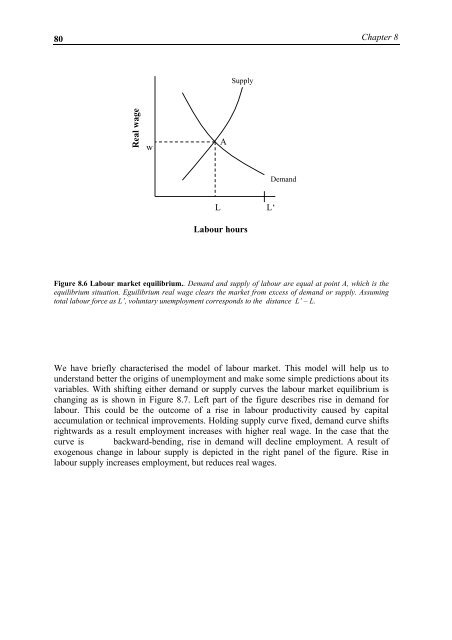
Figure 8.6 Labour market equilibrium.. Demand and supply of labour are equal at point A, which is the<br />
equilibrium situation. Eguilibrium real wage clears the market from excess of demand or supply. Assuming<br />
total labour force as L’, voluntary unemployment corresponds to the distance L’ – L.<br />
We have briefly characterised the model of labour market. This model will help us to<br />
understand better the origins of unemployment and make some simple predictions about its<br />
variables. With shifting either demand or supply curves the labour market equilibrium is<br />
changing as is shown in Figure 8.7. Left part of the figure describes rise in demand for<br />
labour. This could be the outcome of a rise in labour productivity caused by capital<br />
accumulation or technical improvements. Holding supply curve fixed, demand curve shifts<br />
rightwards as a result employment increases with higher real wage. In the case that the<br />
curve is backward-bending, rise in demand will decline employment. A result of<br />
exogenous change in labour supply is depicted in the right panel of the figure. Rise in<br />
labour supply increases employment, but reduces real wages.