
Create successful ePaper yourself
Turn your PDF publications into a flip-book with our unique Google optimized e-Paper software.
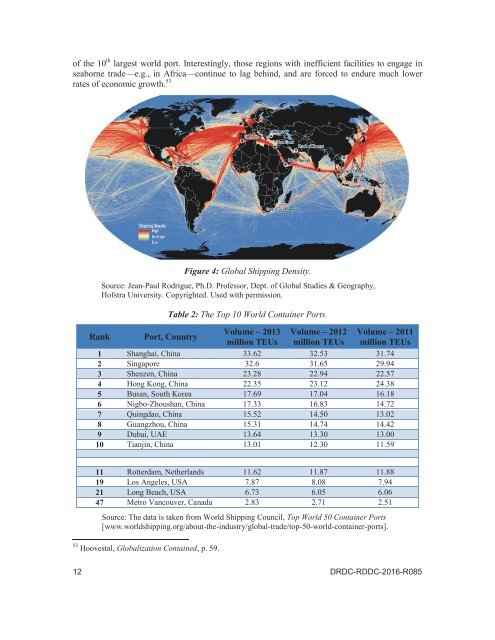
<strong>of</strong> <strong>the</strong> 10 th largest world port. Interestingly, those regions with inefficient facilities to engage in<br />
seaborne trade—e.g., in Africa—continue to lag behind, <strong>and</strong> are forced to endure much lower<br />
rates <strong>of</strong> economic growth. 53<br />
Figure 4: Global Shipping Density.<br />
Source: Jean-Paul Rodrigue, Ph.D. Pr<strong>of</strong>essor, Dept. <strong>of</strong> Global Studies & Geography,<br />
H<strong>of</strong>stra University. Copyrighted. Used with permission.<br />
Table 2: <strong>The</strong> Top 10 World Container Ports.<br />
Rank Port, Country<br />
Volume – 2013 Volume – 2012 Volume – 2011<br />
million TEUs million TEUs million TEUs<br />
1 Shanghai, China 33.62 32.53 31.74<br />
2 Singapore 32.6 31.65 29.94<br />
3 Shenzen, China 23.28 22.94 22.57<br />
4 Hong Kong, China 22.35 23.12 24.38<br />
5 Busan, South Korea 17.69 17.04 16.18<br />
6 Nigbo-Zhoushan, China 17.33 16.83 14.72<br />
7 Quingdao, China 15.52 14.50 13.02<br />
8 Guangzhou, China 15.31 14.74 14.42<br />
9 Dubai, UAE 13.64 13.30 13.00<br />
10 Tianjin, China 13.01 12.30 11.59<br />
11 Rotterdam, Ne<strong>the</strong>rl<strong>and</strong>s 11.62 11.87 11.88<br />
19 Los Angeles, USA 7.87 8.08 7.94<br />
21 Long Beach, USA 6.73 6.05 6.06<br />
47 Metro Vancouver, Canada 2.83 2.71 2.51<br />
Source: <strong>The</strong> data is taken from World Shipping Council, Top World 50 Container Ports<br />
[www.worldshipping.org/about-<strong>the</strong>-industry/global-trade/top-50-world-container-ports].<br />
53 Hoovestal, Globalization Contained, p. 59.<br />
12 DRDC-RDDC-2016-R085