Cultivating Excellence Fact Book 2015–2016
agrium_fb_2015-2016_web
agrium_fb_2015-2016_web

You also want an ePaper? Increase the reach of your titles
YUMPU automatically turns print PDFs into web optimized ePapers that Google loves.
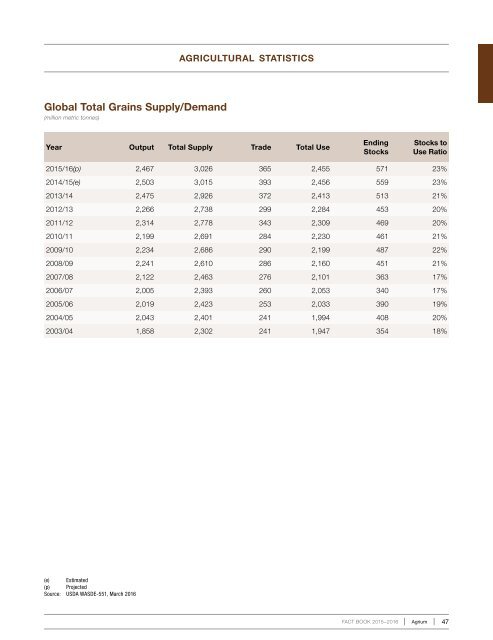
agricultural statistics<br />
Global Total Grains Supply/Demand<br />
(million metric tonnes)<br />
Year Output Total Supply Trade Total Use<br />
Ending<br />
Stocks<br />
Stocks to<br />
Use Ratio<br />
2015/16(p) 2,467 3,026 365 2,455 571 23%<br />
2014/15(e) 2,503 3,015 393 2,456 559 23%<br />
2013/14 2,475 2,926 372 2,413 513 21%<br />
2012/13 2,266 2,738 299 2,284 453 20%<br />
2011/12 2,314 2,778 343 2,309 469 20%<br />
2010/11 2,199 2,691 284 2,230 461 21%<br />
2009/10 2,234 2,686 290 2,199 487 22%<br />
2008/09 2,241 2,610 286 2,160 451 21%<br />
2007/08 2,122 2,463 276 2,101 363 17%<br />
2006/07 2,005 2,393 260 2,053 340 17%<br />
2005/06 2,019 2,423 253 2,033 390 19%<br />
2004/05 2,043 2,401 241 1,994 408 20%<br />
2003/04 1,858 2,302 241 1,947 354 18%<br />
(e) Estimated<br />
(p) Projected<br />
Source: USDA WASDE-551, March 2016<br />
FACT BOOK <strong>2015–2016</strong><br />
Agrium 47