Cultivating Excellence Fact Book 2015–2016
agrium_fb_2015-2016_web
agrium_fb_2015-2016_web

Create successful ePaper yourself
Turn your PDF publications into a flip-book with our unique Google optimized e-Paper software.
fertilizer statistics<br />
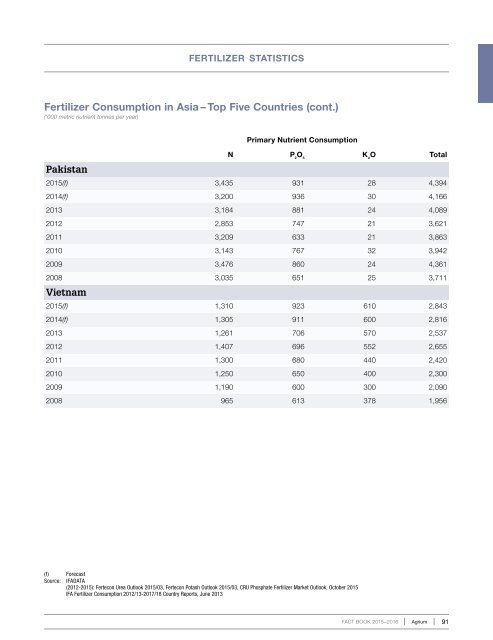
Fertilizer Consumption in Asia – Top Five Countries (cont.)<br />
(‘000 metric nutrient tonnes per year)<br />
Pakistan<br />
Primary Nutrient Consumption<br />
N P 2<br />
O 5<br />
K 2<br />
O Total<br />
2015(f) 3,435 931 28 4,394<br />
2014(f) 3,200 936 30 4,166<br />
2013 3,184 881 24 4,089<br />
2012 2,853 747 21 3,621<br />
2011 3,209 633 21 3,863<br />
2010 3,143 767 32 3,942<br />
2009 3,476 860 24 4,361<br />
2008 3,035 651 25 3,711<br />
Vietnam<br />
2015(f) 1,310 923 610 2,843<br />
2014(f) 1,305 911 600 2,816<br />
2013 1,261 706 570 2,537<br />
2012 1,407 696 552 2,655<br />
2011 1,300 680 440 2,420<br />
2010 1,250 650 400 2,300<br />
2009 1,190 600 300 2,090<br />
2008 965 613 378 1,956<br />
(f) Forecast<br />
Source: IFADATA<br />
(2012-2015): Fertecon Urea Outlook 2015/03, Fertecon Potash Outlook 2015/03, CRU Phosphate Fertilizer Market Outlook, October 2015<br />
IFA Fertilizer Consumption 2012/13-2017/18 Country Reports, June 2013<br />
FACT BOOK <strong>2015–2016</strong><br />
Agrium 91