Cultivating Excellence Fact Book 2015–2016
agrium_fb_2015-2016_web
agrium_fb_2015-2016_web

You also want an ePaper? Increase the reach of your titles
YUMPU automatically turns print PDFs into web optimized ePapers that Google loves.
agricultural statistics<br />
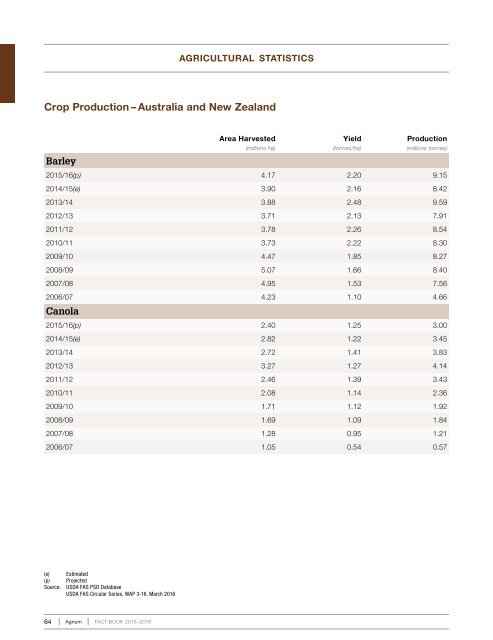
Crop Production – Australia and New Zealand<br />
Barley<br />
Area Harvested<br />
Yield<br />
Production<br />
(millions ha)<br />
(tonnes/ha)<br />
(millions tonnes)<br />
2015/16(p) 4.17 2.20 9.15<br />
2014/15(e) 3.90 2.16 8.42<br />
2013/14 3.88 2.48 9.59<br />
2012/13 3.71 2.13 7.91<br />
2011/12 3.78 2.26 8.54<br />
2010/11 3.73 2.22 8.30<br />
2009/10 4.47 1.85 8.27<br />
2008/09 5.07 1.66 8.40<br />
2007/08 4.95 1.53 7.56<br />
2006/07 4.23 1.10 4.66<br />
Canola<br />
2015/16(p) 2.40 1.25 3.00<br />
2014/15(e) 2.82 1.22 3.45<br />
2013/14 2.72 1.41 3.83<br />
2012/13 3.27 1.27 4.14<br />
2011/12 2.46 1.39 3.43<br />
2010/11 2.08 1.14 2.36<br />
2009/10 1.71 1.12 1.92<br />
2008/09 1.69 1.09 1.84<br />
2007/08 1.28 0.95 1.21<br />
2006/07 1.05 0.54 0.57<br />
(e) Estimated<br />
(p) Projected<br />
Source: USDA FAS PSD Database<br />
USDA FAS Circular Series, WAP 3-16, March 2016<br />
64 Agrium FACT BOOK <strong>2015–2016</strong>