Cultivating Excellence Fact Book 2015–2016
agrium_fb_2015-2016_web
agrium_fb_2015-2016_web

You also want an ePaper? Increase the reach of your titles
YUMPU automatically turns print PDFs into web optimized ePapers that Google loves.
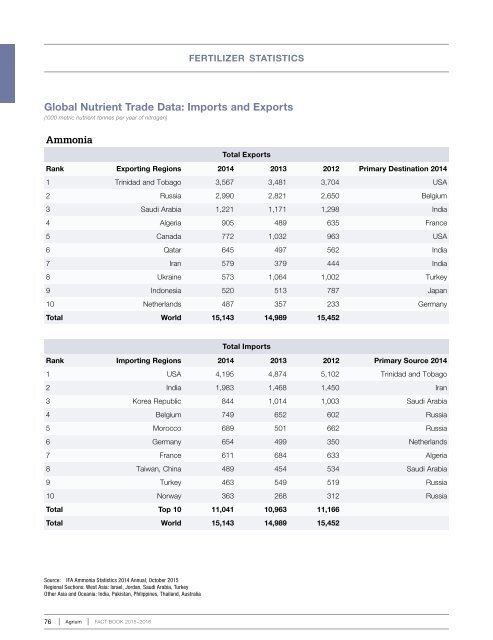
fertilizer statistics<br />
Global Nutrient Trade Data: Imports and Exports<br />
(‘000 metric nutrient tonnes per year of nitrogen)<br />
Ammonia<br />
Total Exports<br />
Rank Exporting Regions 2014 2013 2012 Primary Destination 2014<br />
1 Trinidad and Tobago 3,567 3,481 3,704 USA<br />
2 Russia 2,990 2,821 2,650 Belgium<br />
3 Saudi Arabia 1,221 1,171 1,298 India<br />
4 Algeria 905 489 635 France<br />
5 Canada 772 1,032 963 USA<br />
6 Qatar 645 497 562 India<br />
7 Iran 579 379 444 India<br />
8 Ukraine 573 1,064 1,002 Turkey<br />
9 Indonesia 520 513 787 Japan<br />
10 Netherlands 487 357 233 Germany<br />
Total World 15,143 14,989 15,452<br />
Total Imports<br />
Rank Importing Regions 2014 2013 2012 Primary Source 2014<br />
1 USA 4,195 4,874 5,102 Trinidad and Tobago<br />
2 India 1,983 1,468 1,450 Iran<br />
3 Korea Republic 844 1,014 1,003 Saudi Arabia<br />
4 Belgium 749 652 602 Russia<br />
5 Morocco 689 501 662 Russia<br />
6 Germany 654 499 350 Netherlands<br />
7 France 611 684 633 Algeria<br />
8 Taiwan, China 489 454 534 Saudi Arabia<br />
9 Turkey 463 549 519 Russia<br />
10 Norway 363 268 312 Russia<br />
Total Top 10 11,041 10,963 11,166<br />
Total World 15,143 14,989 15,452<br />
Source: IFA Ammonia Statistics 2014 Annual, October 2015<br />
Regional Sections: West Asia: Israel, Jordan, Saudi Arabia, Turkey<br />
Other Asia and Oceania: India, Pakistan, Philippines, Thailand, Australia<br />
76 Agrium FACT BOOK <strong>2015–2016</strong>