Cultivating Excellence Fact Book 2015–2016
agrium_fb_2015-2016_web
agrium_fb_2015-2016_web

You also want an ePaper? Increase the reach of your titles
YUMPU automatically turns print PDFs into web optimized ePapers that Google loves.
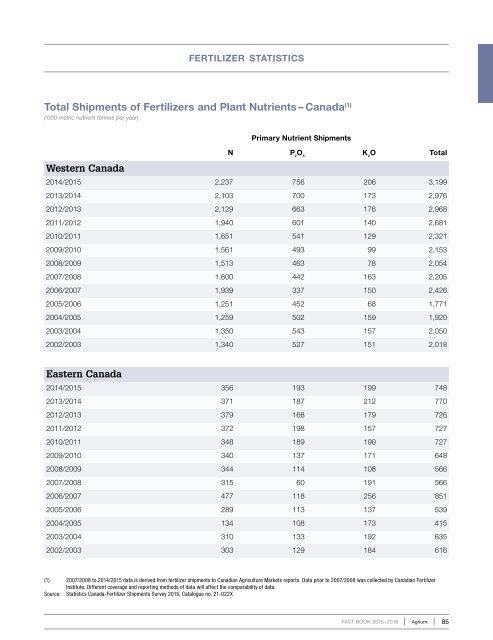
fertilizer statistics<br />
Total Shipments of Fertilizers and Plant Nutrients – Canada (1)<br />
(‘000 metric nutrient tonnes per year)<br />
Western Canada<br />
Primary Nutrient Shipments<br />
N P 2<br />
O 5<br />
K 2<br />
O Total<br />
2014/2015 2,237 756 206 3,199<br />
2013/2014 2,103 700 173 2,976<br />
2012/2013 2,129 663 176 2,968<br />
2011/2012 1,940 601 140 2,681<br />
2010/2011 1,651 541 129 2,321<br />
2009/2010 1,561 493 99 2,153<br />
2008/2009 1,513 463 78 2,054<br />
2007/2008 1,600 442 163 2,205<br />
2006/2007 1,939 337 150 2,426<br />
2005/2006 1,251 452 68 1,771<br />
2004/2005 1,259 502 159 1,920<br />
2003/2004 1,350 543 157 2,050<br />
2002/2003 1,340 527 151 2,018<br />
Eastern Canada<br />
2014/2015 356 193 199 748<br />
2013/2014 371 187 212 770<br />
2012/2013 379 168 179 726<br />
2011/2012 372 198 157 727<br />
2010/2011 348 189 190 727<br />
2009/2010 340 137 171 648<br />
2008/2009 344 114 108 566<br />
2007/2008 315 60 191 566<br />
2006/2007 477 118 256 851<br />
2005/2006 289 113 137 539<br />
2004/2005 134 108 173 415<br />
2003/2004 310 133 192 635<br />
2002/2003 303 129 184 616<br />
(1) 2007/2008 to 2014/2015 data is derived from fertilizer shipments to Canadian Agriculture Markets reports. Data prior to 2007/2008 was collected by Canadian Fertilizer<br />
Institute. Different coverage and reporting methods of data will affect the comparability of data.<br />
Source: Statistics Canada-Fertilizer Shipments Survey 2015, Catalogue no. 21-022X<br />
FACT BOOK <strong>2015–2016</strong><br />
Agrium 85