Cultivating Excellence Fact Book 2015–2016
agrium_fb_2015-2016_web
agrium_fb_2015-2016_web

You also want an ePaper? Increase the reach of your titles
YUMPU automatically turns print PDFs into web optimized ePapers that Google loves.
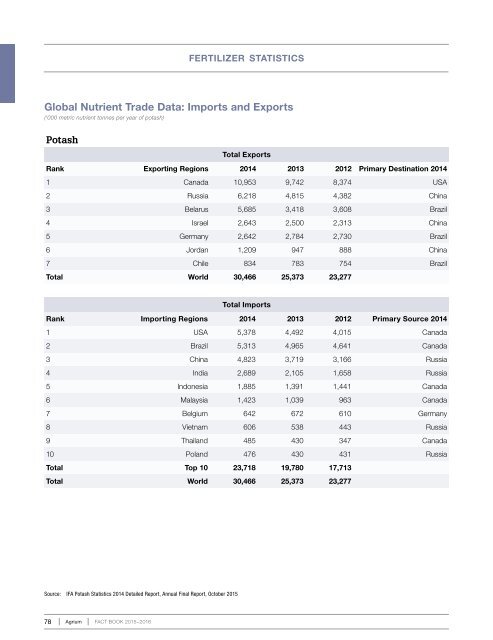
fertilizer statistics<br />
Global Nutrient Trade Data: Imports and Exports<br />
(‘000 metric nutrient tonnes per year of potash)<br />
Potash<br />
Total Exports<br />
Rank Exporting Regions 2014 2013 2012 Primary Destination 2014<br />
1 Canada 10,953 9,742 8,374 USA<br />
2 Russia 6,218 4,815 4,382 China<br />
3 Belarus 5,685 3,418 3,608 Brazil<br />
4 Israel 2,643 2,500 2,313 China<br />
5 Germany 2,642 2,784 2,730 Brazil<br />
6 Jordan 1,209 947 888 China<br />
7 Chile 834 783 754 Brazil<br />
Total World 30,466 25,373 23,277<br />
Total Imports<br />
Rank Importing Regions 2014 2013 2012 Primary Source 2014<br />
1 USA 5,378 4,492 4,015 Canada<br />
2 Brazil 5,313 4,965 4,641 Canada<br />
3 China 4,823 3,719 3,166 Russia<br />
4 India 2,689 2,105 1,658 Russia<br />
5 Indonesia 1,885 1,391 1,441 Canada<br />
6 Malaysia 1,423 1,039 963 Canada<br />
7 Belgium 642 672 610 Germany<br />
8 Vietnam 606 538 443 Russia<br />
9 Thailand 485 430 347 Canada<br />
10 Poland 476 430 431 Russia<br />
Total Top 10 23,718 19,780 17,713<br />
Total World 30,466 25,373 23,277<br />
Source: IFA Potash Statistics 2014 Detailed Report, Annual Final Report, October 2015<br />
78 Agrium FACT BOOK <strong>2015–2016</strong>