Cultivating Excellence Fact Book 2015–2016
agrium_fb_2015-2016_web
agrium_fb_2015-2016_web

You also want an ePaper? Increase the reach of your titles
YUMPU automatically turns print PDFs into web optimized ePapers that Google loves.
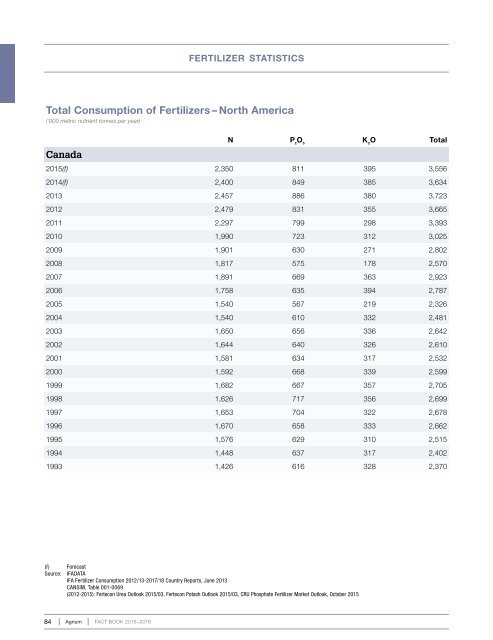
fertilizer statistics<br />
Total Consumption of Fertilizers – North America<br />
(‘000 metric nutrient tonnes per year)<br />
Canada<br />
N P 2<br />
O 5<br />
K 2<br />
O Total<br />
2015(f) 2,350 811 395 3,556<br />
2014(f) 2,400 849 385 3,634<br />
2013 2,457 886 380 3,723<br />
2012 2,479 831 355 3,665<br />
2011 2,297 799 298 3,393<br />
2010 1,990 723 312 3,025<br />
2009 1,901 630 271 2,802<br />
2008 1,817 575 178 2,570<br />
2007 1,891 669 363 2,923<br />
2006 1,758 635 394 2,787<br />
2005 1,540 567 219 2,326<br />
2004 1,540 610 332 2,481<br />
2003 1,650 656 336 2,642<br />
2002 1,644 640 326 2,610<br />
2001 1,581 634 317 2,532<br />
2000 1,592 668 339 2,599<br />
1999 1,682 667 357 2,705<br />
1998 1,626 717 356 2,699<br />
1997 1,653 704 322 2,678<br />
1996 1,670 658 333 2,662<br />
1995 1,576 629 310 2,515<br />
1994 1,448 637 317 2,402<br />
1993 1,426 616 328 2,370<br />
(f)<br />
Source:<br />
Forecast<br />
IFADATA<br />
IFA Fertilizer Consumption 2012/13-2017/18 Country Reports, June 2013<br />
CANSIM, Table 001-0069<br />
(2012-2015): Fertecon Urea Outlook 2015/03, Fertecon Potash Outlook 2015/03, CRU Phosphate Fertilizer Market Outlook, October 2015<br />
84 Agrium FACT BOOK <strong>2015–2016</strong>