Cultivating Excellence Fact Book 2015–2016
agrium_fb_2015-2016_web
agrium_fb_2015-2016_web

Create successful ePaper yourself
Turn your PDF publications into a flip-book with our unique Google optimized e-Paper software.
agricultural statistics<br />
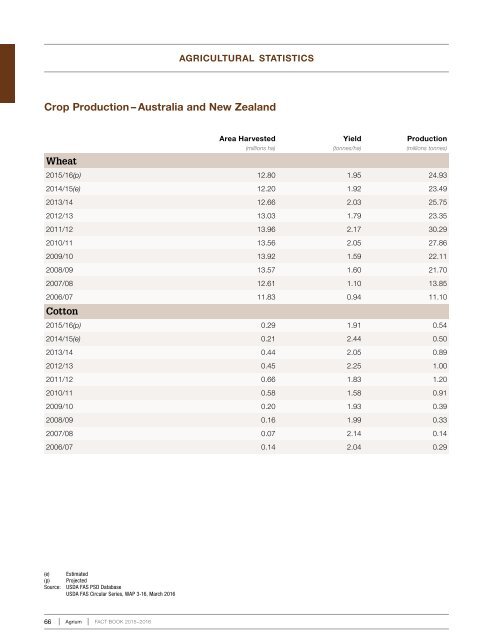
Crop Production – Australia and New Zealand<br />
Wheat<br />
Area Harvested<br />
Yield<br />
Production<br />
(millions ha)<br />
(tonnes/ha)<br />
(millions tonnes)<br />
2015/16(p) 12.80 1.95 24.93<br />
2014/15(e) 12.20 1.92 23.49<br />
2013/14 12.66 2.03 25.75<br />
2012/13 13.03 1.79 23.35<br />
2011/12 13.96 2.17 30.29<br />
2010/11 13.56 2.05 27.86<br />
2009/10 13.92 1.59 22.11<br />
2008/09 13.57 1.60 21.70<br />
2007/08 12.61 1.10 13.85<br />
2006/07 11.83 0.94 11.10<br />
Cotton<br />
2015/16(p) 0.29 1.91 0.54<br />
2014/15(e) 0.21 2.44 0.50<br />
2013/14 0.44 2.05 0.89<br />
2012/13 0.45 2.25 1.00<br />
2011/12 0.66 1.83 1.20<br />
2010/11 0.58 1.58 0.91<br />
2009/10 0.20 1.93 0.39<br />
2008/09 0.16 1.99 0.33<br />
2007/08 0.07 2.14 0.14<br />
2006/07 0.14 2.04 0.29<br />
(e) Estimated<br />
(p) Projected<br />
Source: USDA FAS PSD Database<br />
USDA FAS Circular Series, WAP 3-16, March 2016<br />
66 Agrium FACT BOOK <strong>2015–2016</strong>