Cultivating Excellence Fact Book 2015–2016
agrium_fb_2015-2016_web
agrium_fb_2015-2016_web
You also want an ePaper? Increase the reach of your titles
YUMPU automatically turns print PDFs into web optimized ePapers that Google loves.
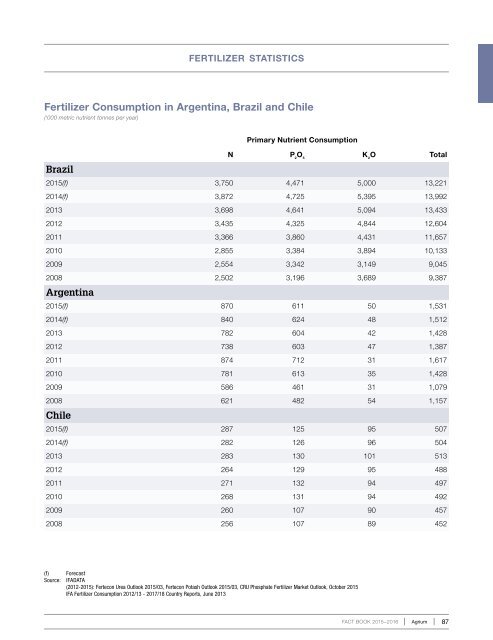
fertilizer statistics<br />
Fertilizer Consumption in Argentina, Brazil and Chile<br />
(‘000 metric nutrient tonnes per year)<br />
Brazil<br />
Primary Nutrient Consumption<br />
N P 2<br />
O 5<br />
K 2<br />
O Total<br />
2015(f) 3,750 4,471 5,000 13,221<br />
2014(f) 3,872 4,725 5,395 13,992<br />
2013 3,698 4,641 5,094 13,433<br />
2012 3,435 4,325 4,844 12,604<br />
2011 3,366 3,860 4,431 11,657<br />
2010 2,855 3,384 3,894 10,133<br />
2009 2,554 3,342 3,149 9,045<br />
2008 2,502 3,196 3,689 9,387<br />
Argentina<br />
2015(f) 870 611 50 1,531<br />
2014(f) 840 624 48 1,512<br />
2013 782 604 42 1,428<br />
2012 738 603 47 1,387<br />
2011 874 712 31 1,617<br />
2010 781 613 35 1,428<br />
2009 586 461 31 1,079<br />
2008 621 482 54 1,157<br />
Chile<br />
2015(f) 287 125 95 507<br />
2014(f) 282 126 96 504<br />
2013 283 130 101 513<br />
2012 264 129 95 488<br />
2011 271 132 94 497<br />
2010 268 131 94 492<br />
2009 260 107 90 457<br />
2008 256 107 89 452<br />
(f) Forecast<br />
Source: IFADATA<br />
(2012-2015): Fertecon Urea Outlook 2015/03, Fertecon Potash Outlook 2015/03, CRU Phosphate Fertilizer Market Outlook, October 2015<br />
IFA Fertilizer Consumption 2012/13 - 2017/18 Country Reports, June 2013<br />
FACT BOOK <strong>2015–2016</strong><br />
Agrium 87


