Cultivating Excellence Fact Book 2015–2016
agrium_fb_2015-2016_web
agrium_fb_2015-2016_web

Create successful ePaper yourself
Turn your PDF publications into a flip-book with our unique Google optimized e-Paper software.
fertilizer statistics<br />
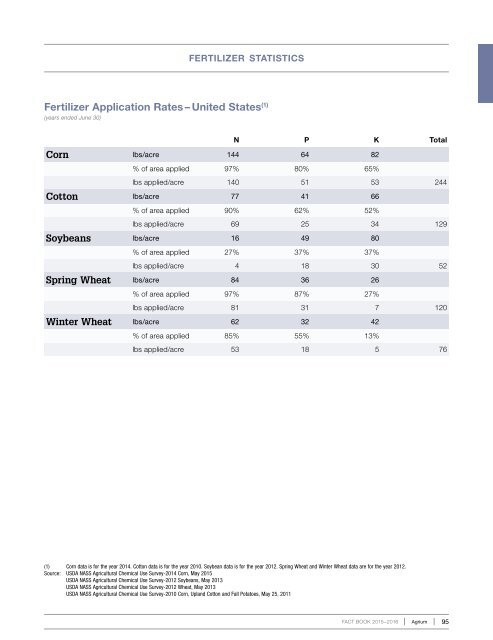
Fertilizer Application Rates – United States (1)<br />
(years ended June 30)<br />
N P K Total<br />
Corn lbs/acre 144 64 82<br />
% of area applied 97% 80% 65%<br />
lbs applied/acre 140 51 53 244<br />
Cotton lbs/acre 77 41 66<br />
% of area applied 90% 62% 52%<br />
lbs applied/acre 69 25 34 129<br />
Soybeans lbs/acre 16 49 80<br />
% of area applied 27% 37% 37%<br />
lbs applied/acre 4 18 30 52<br />
Spring Wheat lbs/acre 84 36 26<br />
% of area applied 97% 87% 27%<br />
lbs applied/acre 81 31 7 120<br />
Winter Wheat lbs/acre 62 32 42<br />
% of area applied 85% 55% 13%<br />
lbs applied/acre 53 18 5 76<br />
(1) Corn data is for the year 2014. Cotton data is for the year 2010. Soybean data is for the year 2012. Spring Wheat and Winter Wheat data are for the year 2012.<br />
Source: USDA NASS Agricultural Chemical Use Survey-2014 Corn, May 2015<br />
USDA NASS Agricultural Chemical Use Survey-2012 Soybeans, May 2013<br />
USDA NASS Agricultural Chemical Use Survey-2012 Wheat, May 2013<br />
USDA NASS Agricultural Chemical Use Survey-2010 Corn, Upland Cotton and Fall Potatoes, May 25, 2011<br />
FACT BOOK <strong>2015–2016</strong><br />
Agrium 95