Cultivating Excellence Fact Book 2015–2016
agrium_fb_2015-2016_web
agrium_fb_2015-2016_web

You also want an ePaper? Increase the reach of your titles
YUMPU automatically turns print PDFs into web optimized ePapers that Google loves.
agricultural statistics<br />
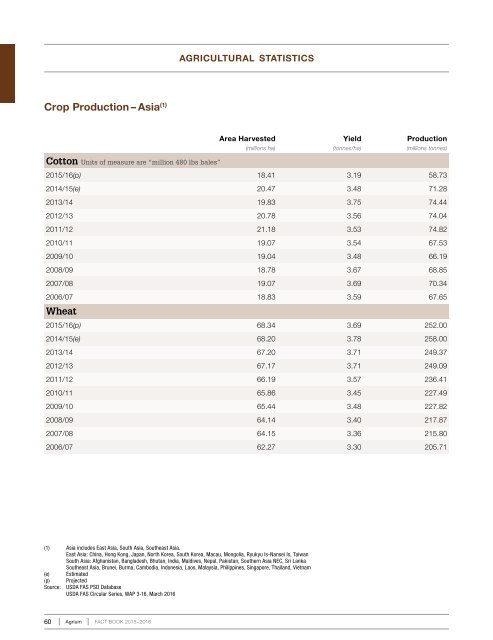
Crop Production – Asia (1)<br />
Area Harvested<br />
(millions ha)<br />
Yield<br />
(tonnes/ha)<br />
Production<br />
(millions tonnes)<br />
Cotton Units of measure are “million 480 lbs bales”<br />
2015/16(p) 18.41 3.19 58.73<br />
2014/15(e) 20.47 3.48 71.28<br />
2013/14 19.83 3.75 74.44<br />
2012/13 20.78 3.56 74.04<br />
2011/12 21.18 3.53 74.82<br />
2010/11 19.07 3.54 67.53<br />
2009/10 19.04 3.48 66.19<br />
2008/09 18.78 3.67 68.85<br />
2007/08 19.07 3.69 70.34<br />
2006/07 18.83 3.59 67.65<br />
Wheat<br />
2015/16(p) 68.34 3.69 252.00<br />
2014/15(e) 68.20 3.78 258.00<br />
2013/14 67.20 3.71 249.37<br />
2012/13 67.17 3.71 249.09<br />
2011/12 66.19 3.57 236.41<br />
2010/11 65.86 3.45 227.49<br />
2009/10 65.44 3.48 227.82<br />
2008/09 64.14 3.40 217.87<br />
2007/08 64.15 3.36 215.80<br />
2006/07 62.27 3.30 205.71<br />
(1) Asia includes East Asia, South Asia, Southeast Asia.<br />
East Asia: China, Hong Kong, Japan, North Korea, South Korea, Macau, Mongolia, Ryukyu Is-Nansei Is, Taiwan<br />
South Asia: Afghanistan, Bangladesh, Bhutan, India, Maldives, Nepal, Pakistan, Southern Asia NEC, Sri Lanka<br />
Southeast Asia, Brunei, Burma, Cambodia, Indonesia, Laos, Malaysia, Philippines, Singapore, Thailand, Vietnam<br />
(e) Estimated<br />
(p) Projected<br />
Source: USDA FAS PSD Database<br />
USDA FAS Circular Series, WAP 3-16, March 2016<br />
60 Agrium FACT BOOK <strong>2015–2016</strong>