

Roadside Revegetation
RoadsideReveg_PollinatorHabitat_DRAFTv1-1_sept2016
RoadsideReveg_PollinatorHabitat_DRAFTv1-1_sept2016

You also want an ePaper? Increase the reach of your titles
YUMPU automatically turns print PDFs into web optimized ePapers that Google loves.
MONITORING PROCEDURES<br />
1<br />
2<br />
3<br />
4<br />
5<br />
6<br />
7<br />
8<br />
9<br />
10<br />
11<br />
12<br />
13<br />
14<br />
15<br />
16<br />
17<br />
18<br />
19<br />
20<br />
21<br />
22<br />
23<br />
24<br />
25<br />
G10<br />
A<br />
fx<br />
Sampling Year: 2006<br />
Number of Transects:<br />
Mean:<br />
Variance of the Mean:<br />
Sampling Year: 2001<br />
Number of Transects:<br />
Mean:<br />
Variance of the Mean:<br />
Two Sample T-Test<br />
Degrees of Freedom (df):<br />
T Statistic:<br />
Statistical Significance:<br />
Difference in Means<br />
Difference:<br />
Variance of Difference:<br />
Standard Error of Difference:<br />
Degrees of Freedom (df):<br />
T Statistic (90% Critical Value):<br />
Lower 90% Confidence Limit:<br />
Upper 90% Confidence Limit:<br />
B<br />
C<br />
Parameter: % Crown Cover<br />
BRCA5<br />
FEID<br />
20<br />
27<br />
19<br />
The following example demonstrates how a confidence interval is determined and how it is<br />
used to interpret data taken at different sampling dates. Members of the revegetation team<br />
believed that California brome (Bromus carinatus) was a short-lived species; that it established<br />
well after seeding but by the fifth year it had very little presence on most sites. They also<br />
believed that Idaho fescue started out slowly but gained dominance over time. The team felt<br />
that by understanding these trends they might develop a better seed mix for sites similar to<br />
the ones they were monitoring. The question they posed was: “Is there a positive, negative,<br />
or no difference in the cover of California brome and Idaho fescue from the first year to the<br />
fifth year after seeding?”<br />
This question required the use of the species cover procedure (see Section 12.3, Species Cover<br />
Procedure) since dominance was being expressed as percent crown cover for each species.<br />
Linear Sampling Design was used for both monitoring dates because the sampling area was<br />
a long cut slope. The data from each sampling date<br />
was summarized into percent cover for California<br />
brome (BRCA5) and entered into Figure 12-18 to 40%<br />
UCL = 36%<br />
obtain means and variance of means. The number<br />
30%<br />
of transects, means, and variance of means for each<br />
FEID<br />
treatment were then entered into Figure 12-25 (cells 20%<br />
LCL = 19%<br />
B9–B11 for earliest sampling date and B4 through B6<br />
10%<br />
for latest sampling date), producing a confidence<br />
UCL = 3%<br />
interval (cells B24 and B25) for comparison. Data entry 0%<br />
was also done in the same manner for Idaho fescue.<br />
-10%<br />
BRCA5<br />
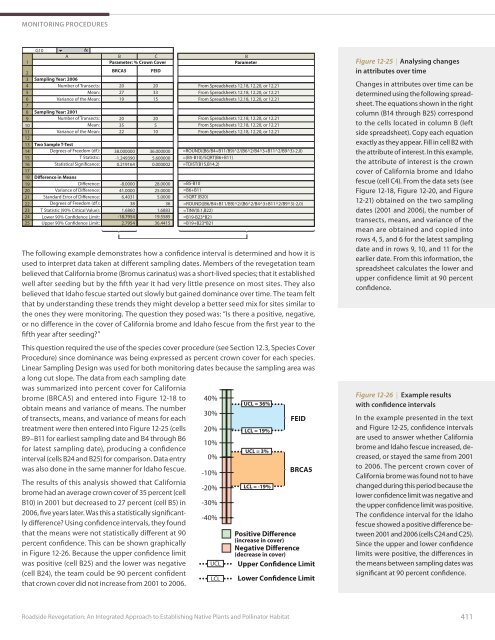
The results of this analysis showed that California<br />
brome had an average crown cover of 35 percent (cell<br />
B10) in 2001 but decreased to 27 percent (cell B5) in<br />
2006, five years later. Was this a statistically significantly<br />
difference? Using confidence intervals, they found<br />
that the means were not statistically different at 90<br />
percent confidence. This can be shown graphically<br />
in Figure 12-26. Because the upper confidence limit<br />
was positive (cell B25) and the lower was negative<br />
(cell B24), the team could be 90 percent confident<br />
that crown cover did not increase from 2001 to 2006.<br />
20<br />
35<br />
22<br />
38.000000<br />
-1.249390<br />
0.219164<br />
-8.0000<br />
41.0000<br />
6.4031<br />
38<br />
1.6860<br />
-18.7954<br />
2.7954<br />
20<br />
33<br />
15<br />
20<br />
5<br />
10<br />
36.000000<br />
5.600000<br />
0.000002<br />
28.0000<br />
25.0000<br />
5.0000<br />
36<br />
1.6883<br />
19.5585<br />
36.4415<br />
B<br />
Parameter<br />
From Spreadsheets 12.18, 12.20, or 12.21<br />
From Spreadsheets 12.18, 12.20, or 12.21<br />
From Spreadsheets 12.18, 12.20, or 12.21<br />
From Spreadsheets 12.18, 12.20, or 12.21<br />
From Spreadsheets 12.18, 12.20, or 12.21<br />
From Spreadsheets 12.18, 12.20, or 12.21<br />
=ROUND((B6/B4+B11/B9)^2/(B6^2/B4^3+B11^2/B9^3)-2,0)<br />
=(B5-B10)/SQRT(B6+B11)<br />
=TDIST(B15,B14,2)<br />
=B5-B10<br />
=B6+B11<br />
=SQRT (B20)<br />
=ROUND((B6/B4+B11/B9)^2/(B6^2/B4^3+B11^2/B9^3)-2,0)<br />
=TINV(0.1,B22)<br />
=B19-B23*B21<br />
=B19+B23*B21<br />
-20%<br />
-30%<br />
-40%<br />
UCL<br />
LCL<br />
LCL = -19%<br />
Positive Difference<br />
(increase in cover)<br />
Negative Difference<br />
(decrease in cover)<br />
Upper Confidence Limit<br />
Lower Confidence Limit<br />
Figure 12-25 | Analysing changes<br />
in attributes over time<br />
Changes in attributes over time can be<br />
determined using the following spreadsheet.<br />
The equations shown in the right<br />
column (B14 through B25) correspond<br />
to the cells located in column B (left<br />
side spreadsheet). Copy each equation<br />
exactly as they appear. Fill in cell B2 with<br />
the attribute of interest. In this example,<br />
the attribute of interest is the crown<br />
cover of California brome and Idaho<br />
fescue (cell C4). From the data sets (see<br />
Figure 12-18, Figure 12-20, and Figure<br />
12-21) obtained on the two sampling<br />
dates (2001 and 2006), the number of<br />
transects, means, and variance of the<br />
mean are obtained and copied into<br />
rows 4, 5, and 6 for the latest sampling<br />
date and in rows 9, 10, and 11 for the<br />
earlier date. From this information, the<br />
spreadsheet calculates the lower and<br />
upper confidence limit at 90 percent<br />
confidence.<br />
Figure 12-26 | Example results<br />
with confidence intervals<br />
In the example presented in the text<br />
and Figure 12-25, confidence intervals<br />
are used to answer whether California<br />
brome and Idaho fescue increased, decreased,<br />
or stayed the same from 2001<br />
to 2006. The percent crown cover of<br />
California brome was found not to have<br />
changed during this period because the<br />
lower confidence limit was negative and<br />
the upper confidence limit was positive.<br />
The confidence interval for the Idaho<br />
fescue showed a positive difference between<br />
2001 and 2006 (cells C24 and C25).<br />
Since the upper and lower confidence<br />
limits were positive, the differences in<br />
the means between sampling dates was<br />
significant at 90 percent confidence.<br />
<strong>Roadside</strong> <strong>Revegetation</strong>: An Integrated Approach to Establishing Native Plants and Pollinator Habitat<br />
411