

OFR_2016_Financial-Stability-Report
OFR_2016_Financial-Stability-Report
OFR_2016_Financial-Stability-Report

You also want an ePaper? Increase the reach of your titles
YUMPU automatically turns print PDFs into web optimized ePapers that Google loves.
Figure 11. Estimated Duration of U.S. Bond Market<br />
Investments (years)<br />
The average duration of U.S. bond investments remains<br />
at long-term high levels<br />
6<br />
5<br />
4<br />
Barclays U.S. Aggregate Index duration<br />
3<br />
1990 1995 2000 2005 2010 2015<br />
Note: Data as of Oct. 31, <strong>2016</strong>.<br />
Source: Bloomberg Finance L.P.<br />
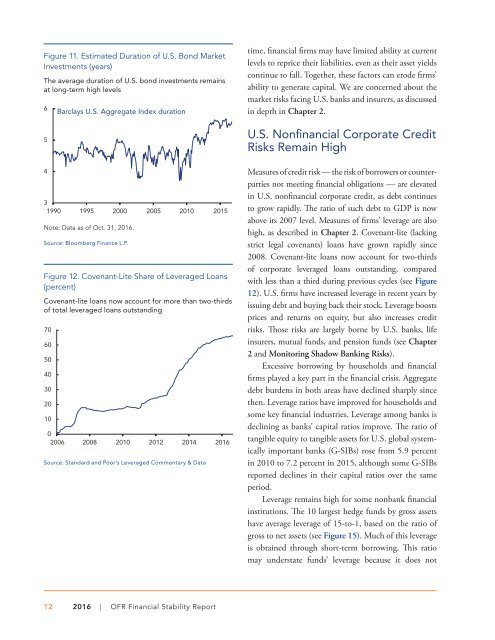
Figure 12. Covenant-Lite Share of Leveraged Loans<br />
(percent)<br />
Covenant-lite loans now account for more than two-thirds<br />
of total leveraged loans outstanding<br />
70<br />
60<br />
50<br />
40<br />
30<br />
20<br />
10<br />
0<br />
2006 2008 2010 2012 2014 <strong>2016</strong><br />
Source: Standard and Poor’s Leveraged Commentary & Data<br />
time, financial firms may have limited ability at current<br />
levels to reprice their liabilities, even as their asset yields<br />
continue to fall. Together, these factors can erode firms’<br />
ability to generate capital. We are concerned about the<br />
market risks facing U.S. banks and insurers, as discussed<br />
in depth in Chapter 2.<br />
U.S. Nonfinancial Corporate Credit<br />
Risks Remain High<br />
Measures of credit risk — the risk of borrowers or counterparties<br />
not meeting financial obligations — are elevated<br />
in U.S. nonfinancial corporate credit, as debt continues<br />
to grow rapidly. The ratio of such debt to GDP is now<br />
above its 2007 level. Measures of firms’ leverage are also<br />
high, as described in Chapter 2. Covenant-lite (lacking<br />
strict legal covenants) loans have grown rapidly since<br />
2008. Covenant-lite loans now account for two-thirds<br />
of corporate leveraged loans outstanding, compared<br />
with less than a third during previous cycles (see Figure<br />
12). U.S. firms have increased leverage in recent years by<br />
issuing debt and buying back their stock. Leverage boosts<br />
prices and returns on equity, but also increases credit<br />
risks. Those risks are largely borne by U.S. banks, life<br />
insurers, mutual funds, and pension funds (see Chapter<br />
2 and Monitoring Shadow Banking Risks).<br />
Excessive borrowing by households and financial<br />
firms played a key part in the financial crisis. Aggregate<br />
debt burdens in both areas have declined sharply since<br />
then. Leverage ratios have improved for households and<br />
some key financial industries. Leverage among banks is<br />
declining as banks’ capital ratios improve. The ratio of<br />
tangible equity to tangible assets for U.S. global systemically<br />
important banks (G-SIBs) rose from 5.9 percent<br />
in 2010 to 7.2 percent in 2015, although some G-SIBs<br />
reported declines in their capital ratios over the same<br />
period.<br />
Leverage remains high for some nonbank financial<br />
institutions. The 10 largest hedge funds by gross assets<br />
have average leverage of 15-to-1, based on the ratio of<br />
gross to net assets (see Figure 15). Much of this leverage<br />
is obtained through short-term borrowing. This ratio<br />
may understate funds’ leverage because it does not<br />
12 <strong>2016</strong> | <strong>OFR</strong> <strong>Financial</strong> <strong>Stability</strong> <strong>Report</strong>