

OFR_2016_Financial-Stability-Report
OFR_2016_Financial-Stability-Report
OFR_2016_Financial-Stability-Report

Create successful ePaper yourself
Turn your PDF publications into a flip-book with our unique Google optimized e-Paper software.
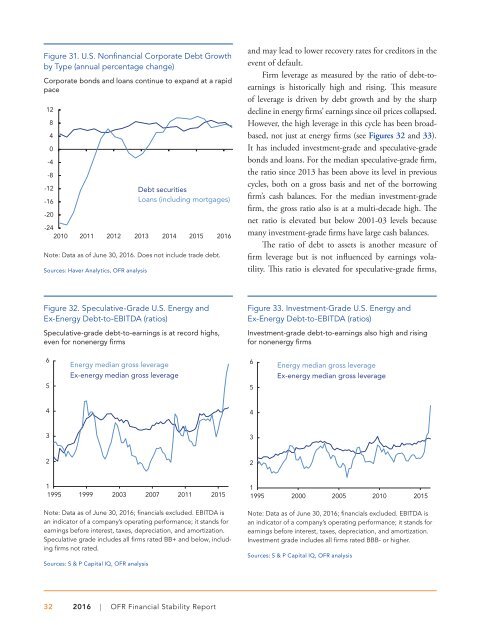
Figure 31. U.S. Nonfinancial Corporate Debt Growth<br />
by Type (annual percentage change)<br />
Corporate bonds and loans continue to expand at a rapid<br />
pace<br />
12<br />
8<br />
4<br />
0<br />
-4<br />
-8<br />
-12<br />
-16<br />
-20<br />
Debt securities<br />
Loans (including mortgages)<br />
-24<br />
2010 2011 2012 2013 2014 2015 <strong>2016</strong><br />
Note: Data as of June 30, <strong>2016</strong>. Does not include trade debt.<br />
Sources: Haver Analytics, <strong>OFR</strong> analysis<br />
and may lead to lower recovery rates for creditors in the<br />
event of default.<br />
Firm leverage as measured by the ratio of debt-toearnings<br />
is historically high and rising. This measure<br />
of leverage is driven by debt growth and by the sharp<br />
decline in energy firms’ earnings since oil prices collapsed.<br />
However, the high leverage in this cycle has been broadbased,<br />
not just at energy firms (see Figures 32 and 33).<br />
It has included investment-grade and speculative-grade<br />
bonds and loans. For the median speculative-grade firm,<br />
the ratio since 2013 has been above its level in previous<br />
cycles, both on a gross basis and net of the borrowing<br />
firm’s cash balances. For the median investment-grade<br />
firm, the gross ratio also is at a multi-decade high. The<br />
net ratio is elevated but below 2001-03 levels because<br />
many investment-grade firms have large cash balances.<br />
The ratio of debt to assets is another measure of<br />
firm leverage but is not influenced by earnings volatility.<br />
This ratio is elevated for speculative-grade firms,<br />
Figure 32. Speculative-Grade U.S. Energy and<br />
Ex-Energy Debt-to-EBITDA (ratios)<br />
Speculative-grade debt-to-earnings is at record highs,<br />
even for nonenergy firms<br />
Figure 33. Investment-Grade U.S. Energy and<br />
Ex-Energy Debt-to-EBITDA (ratios)<br />
Investment-grade debt-to-earnings also high and rising<br />
for nonenergy firms<br />
6<br />
5<br />
Energy median gross leverage<br />
Ex-energy median gross leverage<br />
6<br />
5<br />
Energy median gross leverage<br />
Ex-energy median gross leverage<br />
4<br />
4<br />
3<br />
3<br />
2<br />
2<br />
1<br />
1995 1999 2003 2007 2011 2015<br />
Note: Data as of June 30, <strong>2016</strong>; financials excluded. EBITDA is<br />
an indicator of a company’s operating performance; it stands for<br />
earnings before interest, taxes, depreciation, and amortization.<br />
Speculative grade includes all firms rated BB+ and below, including<br />
firms not rated.<br />
Sources: S & P Capital IQ, <strong>OFR</strong> analysis<br />
1<br />
1995 2000 2005 2010 2015<br />
Note: Data as of June 30, <strong>2016</strong>; financials excluded. EBITDA is<br />
an indicator of a company’s operating performance; it stands for<br />
earnings before interest, taxes, depreciation, and amortization.<br />
Investment grade includes all firms rated BBB- or higher.<br />
Sources: S & P Capital IQ, <strong>OFR</strong> analysis<br />
32 <strong>2016</strong> | <strong>OFR</strong> <strong>Financial</strong> <strong>Stability</strong> <strong>Report</strong>