stock repurchase announcements: a test of market ... - Asbbs.org
stock repurchase announcements: a test of market ... - Asbbs.org
stock repurchase announcements: a test of market ... - Asbbs.org

You also want an ePaper? Increase the reach of your titles
YUMPU automatically turns print PDFs into web optimized ePapers that Google loves.
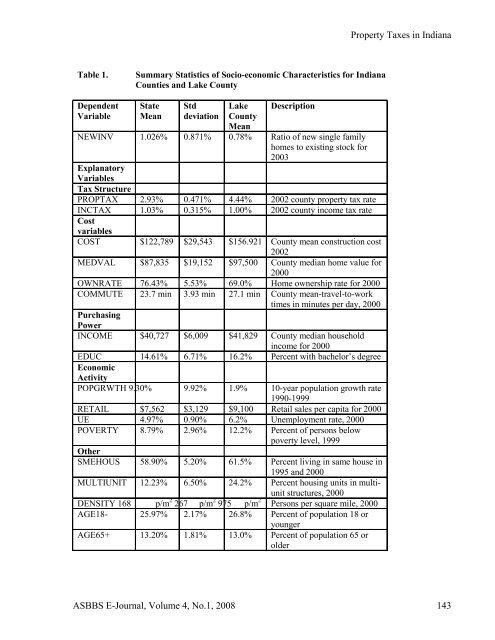
Table 1. Summary Statistics <strong>of</strong> Socio-economic Characteristics for Indiana<br />
Counties and Lake County<br />
Dependent<br />
Variable<br />
State<br />
Mean<br />
Std<br />
deviation<br />
Lake<br />
County<br />
Mean<br />
Description<br />
NEWINV 1.026% 0.871% 0.78% Ratio <strong>of</strong> new single family<br />
homes to existing <strong>stock</strong> for<br />
2003<br />
Explanatory<br />
Variables<br />
Tax Structure<br />
PROPTAX 2.93% 0.471% 4.44% 2002 county property tax rate<br />
INCTAX 1.03% 0.315% 1.00% 2002 county income tax rate<br />
Cost<br />
variables<br />
COST $122,789 $29,543 $156.921 County mean construction cost<br />
2002<br />
MEDVAL $87,835 $19,152 $97,500 County median home value for<br />
2000<br />
OWNRATE 76.43% 5.53% 69.0% Home ownership rate for 2000<br />
COMMUTE 23.7 min 3.93 min 27.1 min County mean-travel-to-work<br />
times in minutes per day, 2000<br />
Purchasing<br />
Power<br />
INCOME $40,727 $6,009 $41,829 County median household<br />
income for 2000<br />
EDUC 14.61% 6.71% 16.2% Percent with bachelor’s degree<br />
Economic<br />
Activity<br />
POPGRWTH 9.30% 9.92% 1.9% 10-year population growth rate<br />
1990-1999<br />
RETAIL $7,562 $3,129 $9,100 Retail sales per capita for 2000<br />
UE 4.97% 0.90% 6.2% Unemployment rate, 2000<br />
POVERTY 8.79% 2.96% 12.2% Percent <strong>of</strong> persons below<br />
poverty level, 1999<br />
Other<br />
SMEHOUS 58.90% 5.20% 61.5% Percent living in same house in<br />
1995 and 2000<br />
MULTIUNIT 12.23% 6.50% 24.2% Percent housing units in multiunit<br />
structures, 2000<br />
DENSITY 168 p/m 2 267 p/m 2 975 p/m 2 Persons per square mile, 2000<br />
AGE18- 25.97% 2.17% 26.8% Percent <strong>of</strong> population 18 or<br />
younger<br />
AGE65+ 13.20% 1.81% 13.0% Percent <strong>of</strong> population 65 or<br />
older<br />
Property Taxes in Indiana<br />
ASBBS E-Journal, Volume 4, No.1, 2008 143