BISICHI MINING PLC ANNUAL REPORT 2017

You also want an ePaper? Increase the reach of your titles
YUMPU automatically turns print PDFs into web optimized ePapers that Google loves.
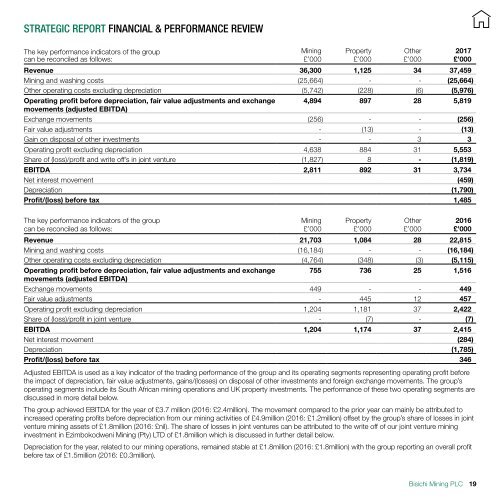
STRATEGIC <strong>REPORT</strong> FINANCIAL & PERFORMANCE REVIEW<br />
The key performance indicators of the group<br />
can be reconciled as follows:<br />
Mining<br />
£’000<br />
Property<br />
£’000<br />
Revenue 36,300 1,125 34 37,459<br />
Mining and washing costs (25,664) - - (25,664)<br />
Other operating costs excluding depreciation (5,742) (228) (6) (5,976)<br />
Operating profit before depreciation, fair value adjustments and exchange 4,894 897 28 5,819<br />
movements (adjusted EBITDA)<br />
Exchange movements (256) - - (256)<br />
Fair value adjustments - (13) - (13)<br />
Gain on disposal of other investments - - 3 3<br />
Operating profit excluding depreciation 4,638 884 31 5,553<br />
Share of (loss)/profit and write off’s in joint venture (1,827) 8 - (1,819)<br />
EBITDA 2,811 892 31 3,734<br />
Net interest movement (459)<br />
Depreciation (1,790)<br />
Profit/(loss) before tax 1,485<br />
Other<br />
£’000<br />
<strong>2017</strong><br />
£’000<br />
The key performance indicators of the group<br />
can be reconciled as follows:<br />
Mining<br />
£’000<br />
Property<br />
£’000<br />
Revenue 21,703 1,084 28 22,815<br />
Mining and washing costs (16,184) - - (16,184)<br />
Other operating costs excluding depreciation (4,764) (348) (3) (5,115)<br />
Operating profit before depreciation, fair value adjustments and exchange 755 736 25 1,516<br />
movements (adjusted EBITDA)<br />
Exchange movements 449 - - 449<br />
Fair value adjustments - 445 12 457<br />
Operating profit excluding depreciation 1,204 1,181 37 2,422<br />
Share of (loss)/profit in joint venture - (7) - (7)<br />
EBITDA 1,204 1,174 37 2,415<br />
Net interest movement (284)<br />
Depreciation (1,785)<br />
Profit/(loss) before tax 346<br />
Adjusted EBITDA is used as a key indicator of the trading performance of the group and its operating segments representing operating profit before<br />
the impact of depreciation, fair value adjustments, gains/(losses) on disposal of other investments and foreign exchange movements. The group’s<br />
operating segments include its South African mining operations and UK property investments. The performance of these two operating segments are<br />
discussed in more detail below.<br />
The group achieved EBITDA for the year of £3.7 million (2016: £2.4million). The movement compared to the prior year can mainly be attributed to<br />
increased operating profits before depreciation from our mining activities of £4.9million (2016: £1.2million) offset by the group’s share of losses in joint<br />
venture mining assets of £1.8million (2016: £nil). The share of losses in joint ventures can be attributed to the write off of our joint venture mining<br />
investment in Ezimbokodweni Mining (Pty) LTD of £1.8million which is discussed in further detail below.<br />
Depreciation for the year, related to our mining operations, remained stable at £1.8million (2016: £1.8million) with the group reporting an overall profit<br />
before tax of £1.5million (2016: £0.3million).<br />
Other<br />
£’000<br />
2016<br />
£’000<br />
Bisichi Mining <strong>PLC</strong><br />
19