
You also want an ePaper? Increase the reach of your titles
YUMPU automatically turns print PDFs into web optimized ePapers that Google loves.
SPECIAL FEATURE: ASIA-PACIFIC FLIGHT ACTIVITY <strong>2020</strong> <strong>Q3</strong><br />
TOP AVIATION HUBS’ PERFORMANCES<br />
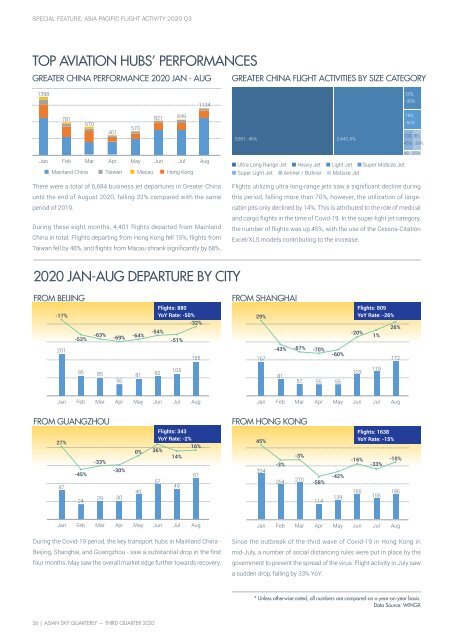
GREATER CHINA PERFORMANCE <strong>2020</strong> JAN - AUG<br />
GREATER CHINA FLIGHT ACTIVITIES BY SIZE CATEGORY<br />
1398<br />
1134<br />
205,<br />
-30%<br />
781<br />
670<br />
461<br />
570<br />
821<br />
849<br />
3,581, -46% 2,443, 6%<br />
184,<br />
-50%<br />
109, 88,<br />
45% -39%<br />
48, -35%<br />
Jan<br />
Feb Mar Apr May Jun Jul<br />
Mainland China Taiwan Macau Hong Kong<br />
Aug<br />
Ultra Long Range Jet Heavy Jet<br />
Super Light Jet Airliner / Bizliner<br />
Light Jet<br />
Midsize Jet<br />
Super Midsize Jet<br />
There were a total of 6,684 business jet departures in Greater China<br />
until the end of August <strong>2020</strong>, falling 32% compared with the same<br />
period of 2019.<br />
During these eight months, 4,401 flights departed from Mainland<br />
China in total. Flights departing from Hong Kong fell 15%, flights from<br />
Taiwan fell by 48%, and flights from Macau shrank significantly by 68%.<br />
Flights utilizing ultra-long-range jets saw a significant decline during<br />
this period, falling more than 70%, however, the utilization of largecabin<br />
jets only declined by 14%. This is attributed to the role of medical<br />
and cargo flights in the time of Covid-19. In the super-light jet category,<br />
the number of flights was up 45%, with the use of the Cessna-Citation<br />
Excel/XLS models contributing to the increase.<br />
<strong>2020</strong> JAN-AUG DEPARTURE BY CITY<br />
FROM BEIJING<br />
Flights: 880<br />
-17% YoY Rate: -50%<br />
29%<br />
-32%<br />
201<br />
-53%<br />
95<br />
-63%<br />
85<br />
-69%<br />
-64%<br />
-54% -20%<br />
-51%<br />
FROM SHANGHAI<br />
Flights: 809<br />
YoY Rate: -26%<br />
-43% -67% -70%<br />
-60%<br />
165 167<br />
172<br />
105 119<br />
92 103<br />
81<br />
81<br />
56 57 55 55<br />
1%<br />
26%<br />
Jan<br />
Feb<br />
Mar<br />
Apr<br />
May<br />
Jun<br />
Jul<br />
Aug<br />
Jan<br />
Feb<br />
Mar<br />
Apr<br />
May<br />
Jun<br />
Jul<br />
Aug<br />
FROM GUANGZHOU<br />
27%<br />
-33%<br />
-45%<br />
47<br />
29<br />
24<br />
-30%<br />
30<br />
0%<br />
40<br />
Flights: 343<br />
YoY Rate: -2%<br />
16%<br />
36%<br />
14%<br />
57<br />
49<br />
67<br />
FROM HONG KONG<br />
45%<br />
-3%<br />
-3%<br />
334<br />
254 270<br />
-58%<br />
114<br />
-42%<br />
139<br />
Flights: 1638<br />
YoY Rate: -15%<br />
-16%<br />
185<br />
-33%<br />
156<br />
-10%<br />
186<br />
Jan<br />
Feb<br />
Mar<br />
Apr<br />
May<br />
Jun<br />
Jul<br />
Aug<br />
Jan<br />
Feb<br />
Mar<br />
Apr<br />
May<br />
Jun<br />
Jul<br />
Aug<br />
During the Covid-19 period, the key transport hubs in Mainland China -<br />
Beijing, Shanghai, and Guangzhou - saw a substantial drop in the first<br />
four months. May saw the overall market edge further towards recovery.<br />
Since the outbreak of the third wave of Covid-19 in Hong Kong in<br />
mid-July, a number of social distancing rules were put in place by the<br />
government to prevent the spread of the virus. Flight activity in July saw<br />
a sudden drop, falling by 33% YoY.<br />
* Unless otherwise noted, all numbers are compared on a year-on-year basis.<br />
Data Source: WINGX<br />
26 | ASIAN SKY QUARTERLY — THIRD QUARTER <strong>2020</strong>