
You also want an ePaper? Increase the reach of your titles
YUMPU automatically turns print PDFs into web optimized ePapers that Google loves.
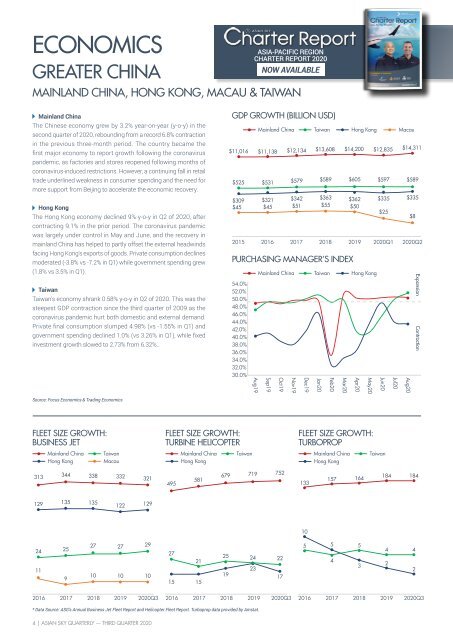
ECONOMICS<br />
GREATER CHINA<br />
ASIA-PACIFIC REGION<br />
CHARTER REPORT <strong>2020</strong><br />
NOW AVAILABLE<br />
MAINLAND CHINA, HONG KONG, MACAU & TAIWAN<br />
Mainland China<br />
The Chinese economy grew by 3.2% year-on-year (y-o-y) in the<br />
second quarter of <strong>2020</strong>, rebounding from a record 6.8% contraction<br />
in the previous three-month period. The country became the<br />
first major economy to report growth following the coronavirus<br />
pandemic, as factories and stores reopened following months of<br />
coronavirus-induced restrictions. However, a continuing fall in retail<br />
trade underlined weakness in consumer spending and the need for<br />
more support from Beijing to accelerate the economic recovery.<br />
Hong Kong<br />
The Hong Kong economy declined 9% y-o-y in Q2 of <strong>2020</strong>, after<br />
contracting 9.1% in the prior period. The coronavirus pandemic<br />
was largely under control in May and June, and the recovery in<br />
mainland China has helped to partly offset the external headwinds<br />
facing Hong Kong's exports of goods. Private consumption declines<br />
moderated (-3.8% vs -7.2% in Q1) while government spending grew<br />
(1.8% vs 3.5% in Q1).<br />
Taiwan<br />
Taiwan's economy shrank 0.58% y-o-y in Q2 of <strong>2020</strong>. This was the<br />
steepest GDP contraction since the third quarter of 2009 as the<br />
coronavirus pandemic hurt both domestic and external demand.<br />
Private final consumption slumped 4.98% (vs -1.55% in Q1) and<br />
government spending declined 1.0% (vs 3.26% in Q1), while fixed<br />
investment growth slowed to 2.73% from 6.32%..<br />
GDP GROWTH (BILLION USD)<br />
$11,016<br />
$525<br />
$309<br />
$45<br />
54.0%<br />
52.0%<br />
50.0%<br />
48.0%<br />
46.0%<br />
44.0%<br />
42.0%<br />
40.0%<br />
38.0%<br />
36.0%<br />
34.0%<br />
32.0%<br />
30.0%<br />
Mainland China<br />
$11,138<br />
$531<br />
$321<br />
$45<br />
Mainland China<br />
$12,134<br />
$579<br />
$342<br />
$51<br />
Taiwan<br />
Taiwan<br />
Hong Kong<br />
Hong Kong<br />
Macau<br />
$13,608 $14,200 $12,835 $14,311<br />
$589 $605 $597 $589<br />
$363 $362 $335 $335<br />
$55 $50<br />
$25<br />
$8<br />
2015 2016 2017 2018 2019 <strong>2020</strong>Q1 <strong>2020</strong>Q2<br />
PURCHASING MANAGER’S INDEX<br />
Aug19<br />
Sep19<br />
Oct19<br />
Nov19<br />
Dec19<br />
Jan20<br />
Feb20<br />
Mar20<br />
Apr20<br />
May20<br />
Jun20<br />
Jul20<br />
Aug20<br />
Expansion Contraction<br />
Source: Focus Economics & Trading Economics<br />
FLEET SIZE GROWTH:<br />
BUSINESS JET<br />
FLEET SIZE GROWTH:<br />
TURBINE HELICOPTER<br />
FLEET SIZE GROWTH:<br />
TURBOPROP<br />
Mainland China Taiwan Mainland China Taiwan Mainland China Taiwan<br />
Hong Kong<br />
Macau<br />
Hong Kong<br />
Hong Kong<br />
313<br />
344<br />
338<br />
332 679 719 752<br />
321<br />
157 164<br />
184<br />
581<br />
184<br />
495<br />
133<br />
129<br />
135<br />
135<br />
122<br />
129<br />
10<br />
24<br />
11<br />
25<br />
9<br />
27 27 29<br />
5 5 5<br />
27<br />
25 24 22<br />
21<br />
4<br />
3<br />
23<br />
10 10 10<br />
19<br />
17<br />
15 15<br />
4<br />
2<br />
4<br />
2<br />
2016 2017 2018 2019 <strong>2020</strong><strong>Q3</strong><br />
2016 2017 2018 2019 <strong>2020</strong><strong>Q3</strong><br />
2016 2017 2018 2019 <strong>2020</strong><strong>Q3</strong><br />
* Data Source: ASG's Annual Business Jet Fleet Report and Helicopter Fleet Report. Turboprop data provided by Amstat.<br />
4 | ASIAN SKY QUARTERLY — THIRD QUARTER <strong>2020</strong>