
You also want an ePaper? Increase the reach of your titles
YUMPU automatically turns print PDFs into web optimized ePapers that Google loves.
Q2 <strong>2020</strong> – GLOBAL MARKET UPDATE: GLOBAL JET CAPITAL<br />
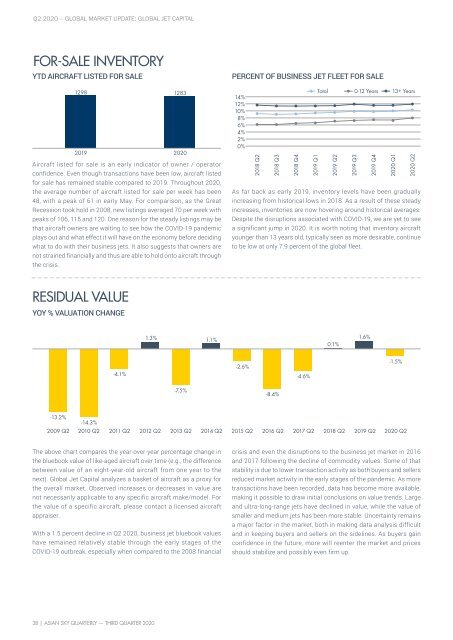
FOR-SALE INVENTORY<br />
YTD AIRCRAFT LISTED FOR SALE<br />
1298 1283<br />
2019<br />
<strong>2020</strong><br />
Aircraft listed for sale is an early indicator of owner / operator<br />
confidence. Even though transactions have been low, aircraft listed<br />
for sale has remained stable compared to 2019. Throughout <strong>2020</strong>,<br />
the average number of aircraft listed for sale per week has been<br />
48, with a peak of 61 in early May. For comparison, as the Great<br />
Recession took hold in 2008, new listings averaged 70 per week with<br />
peaks of 106, 115 and 120. One reason for the steady listings may be<br />
that aircraft owners are waiting to see how the COVID-19 pandemic<br />
plays out and what effect it will have on the economy before deciding<br />
what to do with their business jets. It also suggests that owners are<br />
not strained financially and thus are able to hold onto aircraft through<br />
the crisis.<br />
PERCENT OF BUSINESS JET FLEET FOR SALE<br />
14%<br />
12%<br />
10%<br />
8%<br />
6%<br />
4%<br />
2%<br />
0%<br />
2018 Q2<br />
2018 <strong>Q3</strong><br />
2018 Q4<br />
2019 Q1<br />
As far back as early 2019, inventory levels have been gradually<br />
increasing from historical lows in 2018. As a result of these steady<br />
increases, inventories are now hovering around historical averages.<br />
Despite the disruptions associated with COVID-19, we are yet to see<br />
a significant jump in <strong>2020</strong>. It is worth noting that inventory aircraft<br />
younger than 13 years old, typically seen as more desirable, continue<br />
to be low at only 7.9 percent of the global fleet.<br />
Total 0-12 Years 13+ Years<br />
2019 Q2<br />
2019 <strong>Q3</strong><br />
2019 Q4<br />
<strong>2020</strong> Q1<br />
<strong>2020</strong> Q2<br />
RESIDUAL VALUE<br />
YOY % VALUATION CHANGE<br />
1.3% 1.1%<br />
0.1%<br />
1.6%<br />
-4.1%<br />
-2.6%<br />
-4.6%<br />
-1.5%<br />
-7.5%<br />
-8.4%<br />
-13.2%<br />
-14.3%<br />
2009 Q2 2010 Q2 2011 Q2 2012 Q2 2013 Q2 2014 Q2 2015 Q2 2016 Q2 2017 Q2 2018 Q2<br />
2019 Q2<br />
<strong>2020</strong> Q2<br />
The above chart compares the year-over-year percentage change in<br />
the bluebook value of like-aged aircraft over time (e.g., the difference<br />
between value of an eight-year-old aircraft from one year to the<br />
next). Global Jet Capital analyzes a basket of aircraft as a proxy for<br />
the overall market. Observed increases or decreases in value are<br />
not necessarily applicable to any specific aircraft make/model. For<br />
the value of a specific aircraft, please contact a licensed aircraft<br />
appraiser.<br />
With a 1.5 percent decline in Q2 <strong>2020</strong>, business jet bluebook values<br />
have remained relatively stable through the early stages of the<br />
COVID-19 outbreak, especially when compared to the 2008 financial<br />
crisis and even the disruptions to the business jet market in 2016<br />
and 2017 following the decline of commodity values. Some of that<br />
stability is due to lower transaction activity as both buyers and sellers<br />
reduced market activity in the early stages of the pandemic. As more<br />
transactions have been recorded, data has become more available,<br />
making it possible to draw initial conclusions on value trends. Large<br />
and ultra-long-range jets have declined in value, while the value of<br />
smaller and medium jets has been more stable. Uncertainty remains<br />
a major factor in the market, both in making data analysis difficult<br />
and in keeping buyers and sellers on the sidelines. As buyers gain<br />
confidence in the future, more will reenter the market and prices<br />
should stabilize and possibly even firm up.<br />
38 | ASIAN SKY QUARTERLY — THIRD QUARTER <strong>2020</strong>