
You also want an ePaper? Increase the reach of your titles
YUMPU automatically turns print PDFs into web optimized ePapers that Google loves.
ECONOMICS<br />
EAST ASIA & CENTRAL ASIA<br />
JAPAN, SOUTH KOREA & INDIA<br />
Japan<br />
The Japanese economy shrank 7.9% q-o-q in Q2 <strong>2020</strong>, after a 0.6%<br />
fall in Q1. This was the third straight quarter of contraction and the<br />
steepest on record, amid the severe impact of the COVID-19 crisis.<br />
On an annualized basis, the economy collapsed at a record 28.1%<br />
y-o-y in Q2, compared with forecasts of a 28.6% slump.<br />
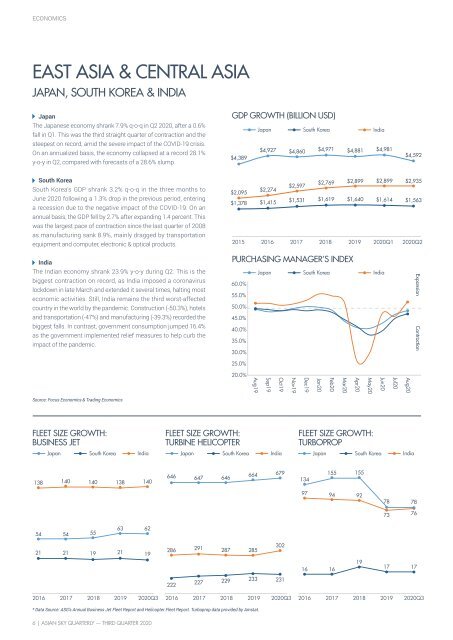
GDP GROWTH (BILLION USD)<br />
Japan South Korea India<br />
$4,927 $4,860<br />
$4,971 $4,881 $4,981<br />
$4,389<br />
$4,592<br />
South Korea<br />
South Korea’s GDP shrank 3.2% q-o-q in the three months to<br />
June <strong>2020</strong> following a 1.3% drop in the previous period, entering<br />
a recession due to the negative impact of the COVID-19. On an<br />
annual basis, the GDP fell by 2.7% after expanding 1.4 percent. This<br />
was the largest pace of contraction since the last quarter of 2008<br />
as manufacturing sank 8.9%, mainly dragged by transportation<br />
equipment and computer, electronic & optical products.<br />
$2,095<br />
$1,378<br />
$2,274<br />
$1,415<br />
$2,597<br />
$1,531<br />
$2,769<br />
$1,619<br />
$2,899<br />
$1,640<br />
$2,899<br />
$1,614<br />
$2,935<br />
$1,563<br />
2015 2016 2017 2018 2019 <strong>2020</strong>Q1 <strong>2020</strong>Q2<br />
India<br />
The Indian economy shrank 23.9% y-o-y during Q2. This is the<br />
biggest contraction on record, as India imposed a coronavirus<br />
lockdown in late March and extended it several times, halting most<br />
economic activities. Still, India remains the third worst-affected<br />
country in the world by the pandemic. Construction (-50.3%), hotels<br />
and transportation (-47%) and manufacturing (-39.3%) recorded the<br />
biggest falls. In contrast, government consumption jumped 16.4%<br />
as the government implemented relief measures to help curb the<br />
impact of the pandemic.<br />
PURCHASING MANAGER’S INDEX<br />
Japan South Korea India<br />
60.0%<br />
55.0%<br />
50.0%<br />
45.0%<br />
40.0%<br />
35.0%<br />
30.0%<br />
25.0%<br />
Expansion Contraction<br />
20.0%<br />
Aug20<br />
Jul20<br />
Jun20<br />
May20<br />
Apr20<br />
Mar20<br />
Feb20<br />
Jan20<br />
Dec19<br />
Nov19<br />
Oct19<br />
Sep19<br />
Aug19<br />
Source: Focus Economics & Trading Economics<br />
FLEET SIZE GROWTH:<br />
BUSINESS JET<br />
FLEET SIZE GROWTH:<br />
TURBINE HELICOPTER<br />
FLEET SIZE GROWTH:<br />
TURBOPROP<br />
Japan South Korea India Japan South Korea India Japan<br />
South Korea India<br />
138<br />
140<br />
140<br />
138 140<br />
646<br />
647<br />
646<br />
664 679<br />
134<br />
155<br />
155<br />
97<br />
94<br />
92<br />
78<br />
78<br />
73<br />
76<br />
54<br />
54<br />
55<br />
63 62<br />
21<br />
21<br />
19<br />
21 19<br />
286<br />
291<br />
287<br />
285<br />
302<br />
16<br />
16<br />
19<br />
17<br />
17<br />
222<br />
227<br />
229<br />
233 231<br />
2016 2017 2018 2019 <strong>2020</strong><strong>Q3</strong><br />
2016 2017 2018 2019 <strong>2020</strong><strong>Q3</strong><br />
2016 2017 2018 2019 <strong>2020</strong><strong>Q3</strong><br />
* Data Source: ASG's Annual Business Jet Fleet Report and Helicopter Fleet Report. Turboprop data provided by Amstat.<br />
6 | ASIAN SKY QUARTERLY — THIRD QUARTER <strong>2020</strong>