
Create successful ePaper yourself
Turn your PDF publications into a flip-book with our unique Google optimized e-Paper software.
MARKET DYNAMICS<br />
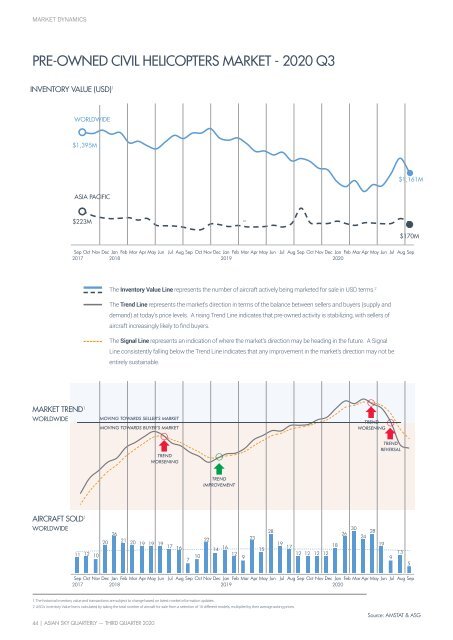
PRE-OWNED CIVIL HELICOPTERS MARKET - <strong>2020</strong> <strong>Q3</strong><br />
INVENTORY VALUE (USD) 1<br />
WORLDWIDE<br />
$1,395M<br />
$1,161M<br />
ASIA PACIFIC<br />
$223M<br />
=<br />
$170M<br />
Sep Oct Nov Dec Jan Feb Mar Apr May Jun Jul Aug Sep Oct Nov Dec Jan Feb Mar Apr May Jun Jul Aug Sep Oct Nov Dec Jan Feb Mar Apr May Jun Jul Aug Sep<br />
2017<br />
2018<br />
2019<br />
<strong>2020</strong><br />
The Inventory Value Line represents the number of aircraft actively being marketed for sale in USD terms. 2<br />
The Trend Line represents the market’s direction in terms of the balance between sellers and buyers (supply and<br />
demand) at today’s price levels. A rising Trend Line indicates that pre-owned activity is stabilizing, with sellers of<br />
aircraft increasingly likely to find buyers.<br />
The Signal Line represents an indication of where the market’s direction may be heading in the future. A Signal<br />
Line consistently falling below the Trend Line indicates that any improvement in the market’s direction may not be<br />
entirely sustainable.<br />
MARKET TREND 1<br />
WORLDWIDE<br />
MOVING TOWARDS SELLER’S MARKET<br />
MOVING TOWARDS BUYER’S MARKET<br />
TREND<br />
WORSENING<br />
TREND<br />
WORSENING<br />
TREND<br />
REVERSAL<br />
TREND<br />
IMPROVEMENT<br />
AIRCRAFT SOLD 1<br />
WORLDWIDE<br />
11 12<br />
10<br />
20<br />
26<br />
21<br />
20<br />
19 19<br />
19<br />
17<br />
16<br />
7 10 22<br />
30<br />
28<br />
26<br />
23 24<br />
19<br />
16<br />
17<br />
18<br />
14 15<br />
12<br />
12 12 12 12<br />
9<br />
28<br />
19<br />
9<br />
13<br />
5<br />
Sep Oct Nov Dec Jan Feb Mar Apr May Jun Jul Aug Sep Oct Nov Dec Jan Feb Mar Apr May Jun Jul Aug Sep Oct Nov Dec Jan Feb Mar Apr May Jun Jul Aug Sep<br />
2017<br />
2018<br />
2019<br />
<strong>2020</strong><br />
1 The historical inventory value and transactions are subject to change based on latest market information updates.<br />
2 ASG’s Inventory Value line is calculated by taking the total number of aircraft for sale from a selection of 16 different models, multiplied by their average asking prices.<br />
44 | ASIAN SKY QUARTERLY — THIRD QUARTER <strong>2020</strong><br />
Source: AMSTAT & ASG