- Page 2:
February 2001 ISBN 0-262-07214-9 37
- Page 6:
2 Gerd Gigerenzer andReinhard Selte
- Page 10:
4 Gerd Gigerenzer andReinhard Selte
- Page 14:
6 Gerd Gigerenzer and Reinhard Selt
- Page 18:
8 Gerd Gigerenzer and Reinhard Selt
- Page 22:
10 Gerd Gigerenzer and Reinhard Sel
- Page 26:
12 Gerd Gigerenzer and Reinhard Sel
- Page 30:
14 Reinhard Selten decision alterna
- Page 34:
16 Reinhard Selten only an optimal
- Page 38:
18 Reinhard Selten ASPIRATION ADAPT
- Page 42:
20 Reinhard Selten The process may
- Page 46:
22 Reinhard Selten last period's va
- Page 50:
24 Reinhard Selten 2. local procedu
- Page 54:
26 Reinhard Selten whether the town
- Page 58:
28 Reinhard Selten The term ex post
- Page 62:
30 Reinhard Selten Human Problem So
- Page 66:
32 Reinhard Selten indirect influen
- Page 70:
34 Reinhard Selten Want Generator a
- Page 74:
36 Reinhard Selten Holland, J., K.
- Page 78:
38 Gerd Gigerenzer The notion of an
- Page 82:
40 Gerd Gigerenzer the psychologist
- Page 86:
42 Gerd Gigerenzer consider two com
- Page 90:
44 Gerd Gigerenzer (Simon 1955). Cu
- Page 94:
46 Gerd Gigerenzer Incommensurabili
- Page 98:
48 Gerd Gigerenzer To summarize, th
- Page 102:
50 Gerd Gigerenzer Selten, R. 1998.
- Page 106:
52 Peter M. Todd for which our mind
- Page 110:
54 Peter M. Todd behavior, as explo
- Page 114:
56 Peter M. Todd make a categorical
- Page 118:
58 Peter M. Todd One-reason Decisio
- Page 122:
60 Peter M. Todd Table 4.1 Performa
- Page 126:
62 Peter M. Todd Such distributions
- Page 130:
64 Peter M. Todd analysis of the re
- Page 134:
66 Peter M. Todd The early limitati
- Page 138:
68 Peter M. Todd within which heuri
- Page 142:
70 Peter M. Todd Luria, A.R. 1968.
- Page 146:
72 Peter Hammerstein Biologist: Let
- Page 150:
74 Peter Hammerstein organism throu
- Page 154:
76 Peter Hammerstein a' =a + 5/(^+1
- Page 158:
78 Peter Hammerstein Biologist: Wel
- Page 162:
80 Peter Hammerstein These are part
- Page 166:
Seated left to right: Bertrand Muni
- Page 170:
84 Abdolkarim Sadrieh et al. issue
- Page 174:
86 Abdolkarim Sadrieh et al. Using
- Page 178:
88 Abdolkarim Sadrieh et al Most im
- Page 182:
90 Abdolkarim Sadrieh et al arbitra
- Page 186:
92 Abdolkarim Sadrieh et al. with t
- Page 190:
94 Abdolkarim Sadrieh et al. search
- Page 194:
96 Abdolkarim Sadrieh et al. Divers
- Page 198:
98 Abdolkarim Sadrieh et al Dichoto
- Page 202:
100 Abdolkarim Sadrieh et al. imple
- Page 206:
102 Abdolkarim Sadrieh et ah Moxnes
- Page 210:
104 Gary Klein stem from limited co
- Page 214:
106 Gary Klein action were undertak
- Page 218:
108 Gary Klein optimization as find
- Page 222:
110 Gary Klein reasonable level. Th
- Page 226:
112 Gary Klein selecting the best o
- Page 230:
124 John W. Payne and James R. Bett
- Page 234:
126 John W. Payne and James R. Bett
- Page 238:
128 John W. Payne and James R. Bett
- Page 242:
130 John W. Payne and James R. Bett
- Page 246:
132 John W. Payne and James R. Bett
- Page 250:
134 John W. Payne and James R. Bett
- Page 254:
136 John W. Payne and James R. Bett
- Page 258:
138 John W. Payne and James R. Bett
- Page 262:
140 John W. Payne and James R. Bett
- Page 266:
142 John W. Payne and James R. Bett
- Page 270:
144 John W. Payne and James R. Bett
- Page 274:
9 Comparing Fast and Frugal Heurist
- Page 278:
Comparing Fast and Frugal Heuristic
- Page 282:
Comparing Fast and Frugal Heuristic
- Page 286:
ComparingFast andFrugal Heuristics
- Page 290:
Comparing Fast and Frugal Heuristic
- Page 294:
Comparing Fast and Frugal Heuristic
- Page 298:
Comparing Fast and Frugal Heuristic
- Page 302:
Comparing Fast and Frugal Heuristic
- Page 306:
Comparing Fast and Frugal Heuristic
- Page 310:
Comparing Fast and Frugal Heuristic
- Page 314:
ation ta emainin Reg = regression,
- Page 318:
Comparing Fast and Frugal Heuristic
- Page 322:
Comparing Fast and Frugal Heuristic
- Page 326:
174 Daniel G. Goldstein et al envir
- Page 330:
176 Daniel G. Goldstein et al. by r
- Page 334:
178 Daniel G. Goldstein et al What
- Page 338:
180 Daniel G. Goldstein et al secon
- Page 342:
182 Daniel G. Goldstein et al due t
- Page 346:
184 Daniel G. Goldstein et al. term
- Page 350:
186 Daniel G. Goldstein et ah depen
- Page 354:
188 Daniel G. Goldstein et al. aver
- Page 358:
190 Daniel G. Goldstein et al. Hoga
- Page 362:
192 Daniel M. T. Fessler and comple
- Page 366:
194 Daniel M.T. Fessler SHAME AND R
- Page 370:
196 Daniel M. T. Fessler and 3. As
- Page 374:
198 Daniel M. T. Fessler In many pr
- Page 378:
200 Daniel M. T. Fessler (i.e., "bl
- Page 382:
202 Daniel M. T. Fessler collaborat
- Page 386:
204 Daniel M. T. Fessler talents. N
- Page 390:
206 Daniel M. T. Fessler this syste
- Page 394:
208 Daniel M. T. Fessler The powerf
- Page 398:
210 Daniel M. T. Fessler 4 Througho
- Page 402:
Daniel M. T. Fessler rect. The auth
- Page 406:
214 Daniel M. T. Fessler Lerner, J.
- Page 410:
216 Ido Erev andAlvin E. Roth adjus
- Page 414:
218 game/ choice prob. S&A2: A2 B2
- Page 418:
220 Ido Erev andAlvin E. Roth \ ('+
- Page 422:
222 Sequential Effects Ido Erev and
- Page 426:
224 Ido Erev andAlvin E. Roth and 1
- Page 430:
226 Ido Erev andAlvin E. Roth The f
- Page 434:
228 Ido Erev andAlvin E. Roth C cho
- Page 438:
230 Ido Erev andAlvin E. Roth behav
- Page 442:
13 Imitation, Social Learning, and
- Page 446:
Imitation, Social Learning, and Pre
- Page 450:
Imitation, Social Learning, and Pre
- Page 454:
Imitation, Social Learning, and Pre
- Page 458:
Imitation, Social Learning, and Pre
- Page 462:
Imitation, Social Learning, and Pre
- Page 466:
Imitation, Social Learning, and Pre
- Page 470:
Imitation, Social Learning, and Pre
- Page 474:
250 Thomas D. Seeley workers) have
- Page 478:
252 Thomas D. Seeley group — be c
- Page 482:
254 Thomas D. Seeley ceased to danc
- Page 486:
256 Thomas D. Seeley scout bees wer
- Page 490:
258 Thomas D. Seeley ceased their d
- Page 494:
260 Thomas D. Seeley operates with
- Page 498:
NL r*;- Seated, left to right: Ido
- Page 502:
264 Barbara A. Mellers et al Darwin
- Page 506:
266 Barbara A. Mellers et al (Mesqu
- Page 510:
268 Barbara A. Mellers et al test s
- Page 514:
270 Barbara A. Mellers et ah decisi
- Page 518:
272 Barbara A. Mellers et ah Imitat
- Page 522:
274 Barbara A. Mellers et al. more
- Page 526:
276 Barbara A. Metiers et al REFERE
- Page 530:
278 Barbara A. Mellers et al Loewen
- Page 534:
16 Norms and Bounded Rationality Ro
- Page 538:
Norms and Bounded Rationality 283 g
- Page 542: Probability Density of X Norms and
- Page 546: Norms and Bounded Rationality 287 E
- Page 550: 3 Va E 3 J— lib 3 LU 1 0.9 0.8 0.
- Page 554: Norms and Bounded Rationality 291 e
- Page 558: m/a Norms and Bounded Rationality 2
- Page 562: Norms and Bounded Rationality 295 f
- Page 566: 17 Prominence Theory as a Tool to M
- Page 570: Prominence Theory 299 constructs he
- Page 574: Prominence Theory 301 The presentat
- Page 578: Prominence Theory 303 cruder relati
- Page 582: Prominence Theory 305 frequency. We
- Page 586: Prominence Theory 307 90%, 100%o, i
- Page 590: Prominence Theory 309 equal relativ
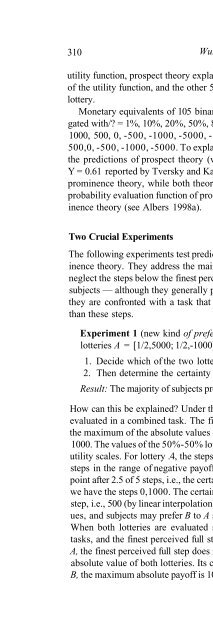
- Page 596: 312 WulfAlbers AGGREGATION OF UTILI
- Page 600: 314 WulfAlters Nash problem with co
- Page 604: 316 WulfAlbers concession steps in
- Page 608: 18 Goodwill Accounting and the Proc
- Page 612: Goodwill Accounting and the Process
- Page 616: Goodwill Accounting and the Process
- Page 620: Environment Information w Personal
- Page 624: Goodwill Accounting and the Process
- Page 628: Goodwill Accounting and the Process
- Page 632: Goodwill Accounting and the Process
- Page 638: 334 Kevin A. McCabe and Vernon L. S
- Page 642:
able 18.3 200 iterations < g < 900.
- Page 646:
338 Kevin A. McCabe and Vernon L. S
- Page 650:
340 Kevin A. McCabe and Vernon L. S
- Page 654:
19 Group Report: What Is the Role o
- Page 658:
What Is the Role of Culture in Boun
- Page 662:
What Is the Role of Culture in Boun
- Page 666:
What Is the Role of Culture in Boun
- Page 670:
What Is the Role of Culture in Boun
- Page 674:
What Is the Role of Culture in Boun
- Page 678:
What Is the Role of Culture in Boun
- Page 682:
What Is the Role of Culture in Boun
- Page 686:
What Is the Role of Culture in Boun
- Page 690:
362 Subject Index Bayesian rational
- Page 694:
364 Subject Index environment conti
- Page 698:
366 Subject Index hill-climbing alg
- Page 702:
368 Subject Index probability 3, 6,
- Page 706:
370 value continued estimation of c
- Page 710:
xii List of Participants with Field
- Page 714:
xiv List of Participants with Field
- Page 718:
Abbink, K. 29 Abdellaoui, M. 92 Ain
- Page 722:
Frisch, D. 104, 127, 134 Gagne,R.M.
- Page 726:
Mitchell, T.R. 130 Mookerjee, D. 21
- Page 730:
Name Index 317 Wong, C. 206 Zajonc,