Section 3.10: Site Plans and Technical Data - Rick Neufeld Comments
Section 3.10: Site Plans and Technical Data - Rick Neufeld Comments
Section 3.10: Site Plans and Technical Data - Rick Neufeld Comments

You also want an ePaper? Increase the reach of your titles
YUMPU automatically turns print PDFs into web optimized ePapers that Google loves.
Northern Gateway Pipelines Inc.<br />
<strong>Section</strong> <strong>3.10</strong>: <strong>Site</strong> <strong>Plans</strong> <strong>and</strong> <strong>Technical</strong> <strong>Data</strong><br />
Table of Contents<br />
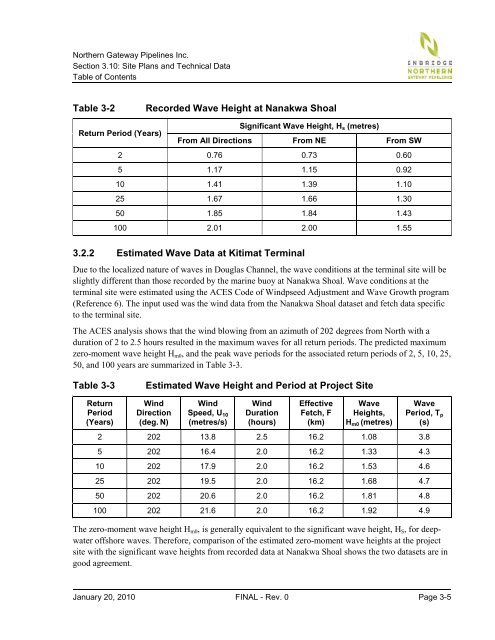
Table 3-2 Recorded Wave Height at Nanakwa Shoal<br />
Return Period (Years)<br />
Significant Wave Height, Hs (metres)<br />
From All Directions From NE From SW<br />
2 0.76 0.73 0.60<br />
5 1.17 1.15 0.92<br />
10 1.41 1.39 1.10<br />
25 1.67 1.66 1.30<br />
50 1.85 1.84 1.43<br />
100 2.01 2.00 1.55<br />
3.2.2 Estimated Wave <strong>Data</strong> at Kitimat Terminal<br />
Due to the localized nature of waves in Douglas Channel, the wave conditions at the terminal site will be<br />
slightly different than those recorded by the marine buoy at Nanakwa Shoal. Wave conditions at the<br />
terminal site were estimated using the ACES Code of Windpseed Adjustment <strong>and</strong> Wave Growth program<br />
(Reference 6). The input used was the wind data from the Nanakwa Shoal dataset <strong>and</strong> fetch data specific<br />
to the terminal site.<br />
The ACES analysis shows that the wind blowing from an azimuth of 202 degrees from North with a<br />
duration of 2 to 2.5 hours resulted in the maximum waves for all return periods. The predicted maximum<br />
zero-moment wave height Hm0, <strong>and</strong> the peak wave periods for the associated return periods of 2, 5, 10, 25,<br />
50, <strong>and</strong> 100 years are summarized in Table 3-3.<br />
Table 3-3 Estimated Wave Height <strong>and</strong> Period at Project <strong>Site</strong><br />
Return<br />
Period<br />
(Years)<br />
Wind<br />
Direction<br />
(deg. N)<br />
Wind<br />
Speed, U10<br />
(metres/s)<br />
Wind<br />
Duration<br />
(hours)<br />
Effective<br />
Fetch, F<br />
(km)<br />
Wave<br />
Heights,<br />
Hm0 (metres)<br />
Wave<br />
Period, Tp<br />
(s)<br />
2 202 13.8 2.5 16.2 1.08 3.8<br />
5 202 16.4 2.0 16.2 1.33 4.3<br />
10 202 17.9 2.0 16.2 1.53 4.6<br />
25 202 19.5 2.0 16.2 1.68 4.7<br />
50 202 20.6 2.0 16.2 1.81 4.8<br />
100 202 21.6 2.0 16.2 1.92 4.9<br />
The zero-moment wave height Hm0, is generally equivalent to the significant wave height, HS, for deepwater<br />
offshore waves. Therefore, comparison of the estimated zero-moment wave heights at the project<br />
site with the significant wave heights from recorded data at Nanakwa Shoal shows the two datasets are in<br />
good agreement.<br />
January 20, 2010 FINAL - Rev. 0 Page 3-5