- Page 1 and 2:
Air Quality Guidelines Particulate
- Page 3 and 4:
Abstract Th e WHO air quality guide
- Page 5 and 6:
Acknowledgements Th is work was sup
- Page 7 and 8:
VI Th e infl uence of location on t
- Page 9 and 10:
VIII AIR QUALITY GUIDELINES 11. Ozo
- Page 12 and 13:
Introduction Th e fi rst edition of
- Page 14 and 15:
INTRODUCTION • Chapters 1 and 2 a
- Page 16 and 17:
INTRODUCTION pollutants such as nit
- Page 18:
Part 1 Application of air quality g
- Page 21 and 22:
10 Introduction AIR QUALITY GUIDELI
- Page 23 and 24:
12 AIR QUALITY GUIDELINES specific
- Page 25 and 26:
14 AIR QUALITY GUIDELINES pipe of a
- Page 27 and 28:
16 AIR QUALITY GUIDELINES of the ex
- Page 29 and 30:
18 AIR QUALITY GUIDELINES of other
- Page 31 and 32:
20 Box 1. Main categories of air po
- Page 33 and 34:
22 AIR QUALITY GUIDELINES Fig. 3. P
- Page 35 and 36:
24 Source profile Coarse particles
- Page 37 and 38:
26 Source: Air Quality Expert Group
- Page 39 and 40:
28 AIR QUALITY GUIDELINES occurs on
- Page 41 and 42:
30 AIR QUALITY GUIDELINES 16. Urban
- Page 43 and 44:
32 AIR QUALITY GUIDELINES substanti
- Page 45 and 46:
34 AIR QUALITY GUIDELINES In Europe
- Page 47 and 48:
36 AIR QUALITY GUIDELINES In many m
- Page 49 and 50:
38 AIR QUALITY GUIDELINES respectiv
- Page 51 and 52:
40 AIR QUALITY GUIDELINES rather lo
- Page 53 and 54:
42 AIR QUALITY GUIDELINES Table 2.
- Page 55 and 56:
44 AIR QUALITY GUIDELINES Fig. 6. H
- Page 57 and 58:
46 AIR QUALITY GUIDELINES Fig. 8. A
- Page 59 and 60:
48 AIR QUALITY GUIDELINES Fig. 9. A
- Page 61 and 62:
50 AIR QUALITY GUIDELINES Fig. 10.
- Page 63 and 64:
52 AIR QUALITY GUIDELINES Europe In
- Page 65 and 66:
54 AIR QUALITY GUIDELINES Fig. 15.
- Page 67 and 68:
56 AIR QUALITY GUIDELINES 20. Ulrik
- Page 69 and 70:
58 AIR QUALITY GUIDELINES 47. Guerr
- Page 72 and 73:
3. Human exposure to air pollution
- Page 74 and 75:
HUMAN EXPOSURE TO AIR POLLUTION Whe
- Page 76 and 77:
HUMAN EXPOSURE TO AIR POLLUTION Peo
- Page 78 and 79:
HUMAN EXPOSURE TO AIR POLLUTION pra
- Page 80 and 81:
HUMAN EXPOSURE TO AIR POLLUTION A r
- Page 82 and 83:
HUMAN EXPOSURE TO AIR POLLUTION Ass
- Page 84 and 85:
HUMAN EXPOSURE TO AIR POLLUTION Spa
- Page 86 and 87:
HUMAN EXPOSURE TO AIR POLLUTION bot
- Page 88 and 89:
HUMAN EXPOSURE TO AIR POLLUTION per
- Page 90 and 91:
HUMAN EXPOSURE TO AIR POLLUTION Ano
- Page 92 and 93:
HUMAN EXPOSURE TO AIR POLLUTION Ref
- Page 94 and 95:
HUMAN EXPOSURE TO AIR POLLUTION 27.
- Page 96:
HUMAN EXPOSURE TO AIR POLLUTION 55.
- Page 99 and 100:
88 AIR QUALITY GUIDELINES such as a
- Page 101 and 102:
90 AIR QUALITY GUIDELINES proportio
- Page 103 and 104:
92 AIR QUALITY GUIDELINES exposure
- Page 105 and 106:
94 AIR QUALITY GUIDELINES Time seri
- Page 107 and 108:
96 AIR QUALITY GUIDELINES This desi
- Page 109 and 110:
98 AIR QUALITY GUIDELINES analyses
- Page 111 and 112:
100 AIR QUALITY GUIDELINES time ser
- Page 113 and 114:
102 AIR QUALITY GUIDELINES Neverthe
- Page 115 and 116:
104 AIR QUALITY GUIDELINES 27. Schw
- Page 117 and 118: 106 AIR QUALITY GUIDELINES 58. Pete
- Page 119 and 120: 108 AIR QUALITY GUIDELINES 89. Kunz
- Page 122 and 123: 5. Determinants of susceptibility M
- Page 124 and 125: DETERMINANTS OF SUSCEPTIBILITY Anim
- Page 126 and 127: DETERMINANTS OF SUSCEPTIBILITY necr
- Page 128 and 129: DETERMINANTS OF SUSCEPTIBILITY By 2
- Page 130 and 131: DETERMINANTS OF SUSCEPTIBILITY envi
- Page 132 and 133: DETERMINANTS OF SUSCEPTIBILITY to t
- Page 134 and 135: DETERMINANTS OF SUSCEPTIBILITY grow
- Page 136 and 137: DETERMINANTS OF SUSCEPTIBILITY dise
- Page 138 and 139: DETERMINANTS OF SUSCEPTIBILITY 3. U
- Page 140 and 141: DETERMINANTS OF SUSCEPTIBILITY 34.
- Page 142 and 143: DETERMINANTS OF SUSCEPTIBILITY 63.
- Page 144: DETERMINANTS OF SUSCEPTIBILITY 94.
- Page 147 and 148: 136 AIR QUALITY GUIDELINES by highe
- Page 149 and 150: 138 AIR QUALITY GUIDELINES developi
- Page 151 and 152: 140 AIR QUALITY GUIDELINES disease
- Page 153 and 154: 142 Source: Cohen et al. (22). PM10
- Page 155 and 156: 144 AIR QUALITY GUIDELINES communit
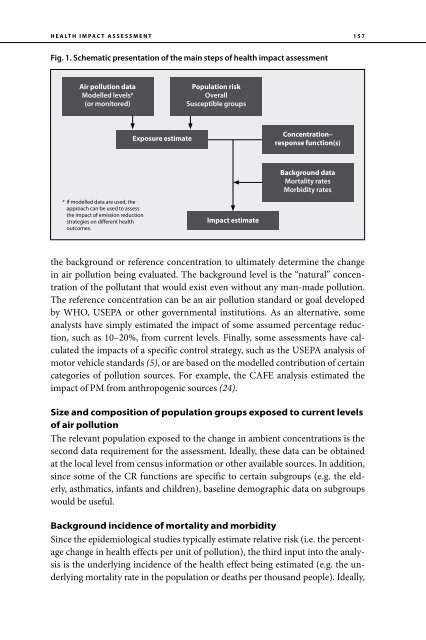
- Page 157 and 158: 146 AIR QUALITY GUIDELINES concentr
- Page 159 and 160: 148 AIR QUALITY GUIDELINES 2. Draft
- Page 161 and 162: 150 AIR QUALITY GUIDELINES 29. Kesk
- Page 163 and 164: 152 AIR QUALITY GUIDELINES 56. Zhu
- Page 165 and 166: 154 AIR QUALITY GUIDELINES such as
- Page 167: 156 AIR QUALITY GUIDELINES in 12 Eu
- Page 171 and 172: 160 AIR QUALITY GUIDELINES Extrapol
- Page 173 and 174: 162 AIR QUALITY GUIDELINES factors
- Page 175 and 176: 164 AIR QUALITY GUIDELINES interval
- Page 177 and 178: 166 AIR QUALITY GUIDELINES Uncertai
- Page 179 and 180: 168 AIR QUALITY GUIDELINES in the U
- Page 181 and 182: 170 AIR QUALITY GUIDELINES 22. Holl
- Page 184 and 185: 8. Application of guidelines in pol
- Page 186 and 187: APPLICATION OF GUIDELINES IN POLICY
- Page 188 and 189: APPLICATION OF GUIDELINES IN POLICY
- Page 190 and 191: APPLICATION OF GUIDELINES IN POLICY
- Page 192 and 193: APPLICATION OF GUIDELINES IN POLICY
- Page 194 and 195: APPLICATION OF GUIDELINES IN POLICY
- Page 196 and 197: APPLICATION OF GUIDELINES IN POLICY
- Page 198 and 199: APPLICATION OF GUIDELINES IN POLICY
- Page 200 and 201: 9. Indoor air quality 1 Kalpana Bal
- Page 202 and 203: INDOOR AIR QUALITY such circumstanc
- Page 204 and 205: INDOOR AIR QUALITY cleaner fuels, h
- Page 206 and 207: INDOOR AIR QUALITY Table 2. Toxic p
- Page 208 and 209: INDOOR AIR QUALITY 200, and LPG (li
- Page 210 and 211: INDOOR AIR QUALITY Evidence has als
- Page 212 and 213: INDOOR AIR QUALITY Table 6. Burden
- Page 214 and 215: INDOOR AIR QUALITY are highly depen
- Page 216 and 217: INDOOR AIR QUALITY Most evidence av
- Page 218 and 219:
How assessed INDOOR AIR QUALITY Nat
- Page 220 and 221:
INDOOR AIR QUALITY 17. Bhargava A e
- Page 222 and 223:
INDOOR AIR QUALITY 46. Strachan DP,
- Page 224:
INDOOR AIR QUALITY 71. Bruce NG et
- Page 228 and 229:
10. Particulate matter Jonathan M.
- Page 230 and 231:
PARTICULATE MATTER aerodynamic diam
- Page 232 and 233:
PARTICULATE MATTER Ambient concentr
- Page 234 and 235:
PARTICULATE MATTER meteorology, the
- Page 236 and 237:
PARTICULATE MATTER Methods for samp
- Page 238 and 239:
PARTICULATE MATTER Table 1. Summary
- Page 240 and 241:
PARTICULATE MATTER ambient air. The
- Page 242 and 243:
PARTICULATE MATTER Mechanisms of to
- Page 244 and 245:
PARTICULATE MATTER The toxicity of
- Page 246 and 247:
PARTICULATE MATTER Mortality and ho
- Page 248 and 249:
PARTICULATE MATTER attributed solel
- Page 250 and 251:
PARTICULATE MATTER composed of low-
- Page 252 and 253:
PARTICULATE MATTER modulating biolo
- Page 254 and 255:
PARTICULATE MATTER to concentrated
- Page 256 and 257:
PARTICULATE MATTER report, conclude
- Page 258 and 259:
PARTICULATE MATTER Looking across t
- Page 260 and 261:
PARTICULATE MATTER measurements are
- Page 262 and 263:
PARTICULATE MATTER Human exposure s
- Page 264 and 265:
PARTICULATE MATTER Findings Referen
- Page 266 and 267:
PARTICULATE MATTER Findings Referen
- Page 268 and 269:
PARTICULATE MATTER Findings Referen
- Page 270 and 271:
3 4 12 15 PARTICULATE MATTER 10 21
- Page 272 and 273:
PARTICULATE MATTER Table 4. Cohort
- Page 274 and 275:
PARTICULATE MATTER Reference Popula
- Page 276 and 277:
PARTICULATE MATTER mechanisms for t
- Page 278 and 279:
Cardiovascular 4 Cardiovascular 7 P
- Page 280 and 281:
PARTICULATE MATTER human health eff
- Page 282 and 283:
PARTICULATE MATTER medical clinic f
- Page 284 and 285:
PARTICULATE MATTER range of concent
- Page 286 and 287:
PARTICULATE MATTER analysis is base
- Page 288 and 289:
PARTICULATE MATTER PM10 is suggeste
- Page 290 and 291:
PARTICULATE MATTER distribution of
- Page 292 and 293:
PARTICULATE MATTER 11. Daniels M et
- Page 294 and 295:
PARTICULATE MATTER 39. Hoek G, Brun
- Page 296 and 297:
PARTICULATE MATTER 69. Kinney PL et
- Page 298 and 299:
PARTICULATE MATTER 95. Brunekreef B
- Page 300 and 301:
PARTICULATE MATTER 126. Seagrave J
- Page 302 and 303:
PARTICULATE MATTER 154. Wellenius G
- Page 304 and 305:
PARTICULATE MATTER 184. Oberdorster
- Page 306 and 307:
PARTICULATE MATTER 213. Costa DL, D
- Page 308 and 309:
PARTICULATE MATTER 240. Saldiva PH
- Page 310 and 311:
PARTICULATE MATTER 271. Dominici F
- Page 312 and 313:
PARTICULATE MATTER 294. Pope CA et
- Page 314 and 315:
PARTICULATE MATTER 321. Delfino RJ
- Page 316:
PARTICULATE MATTER 350. Sutherland
- Page 319 and 320:
308 AIR QUALITY GUIDELINES Atmosphe
- Page 321 and 322:
310 AIR QUALITY GUIDELINES Fig. 1.
- Page 323 and 324:
312 AIR QUALITY GUIDELINES males (1
- Page 325 and 326:
314 AIR QUALITY GUIDELINES • Ther
- Page 327 and 328:
316 AIR QUALITY GUIDELINES the high
- Page 329 and 330:
318 AIR QUALITY GUIDELINES effect o
- Page 331 and 332:
320 AIR QUALITY GUIDELINES (range 2
- Page 333 and 334:
322 AIR QUALITY GUIDELINES personal
- Page 335 and 336:
324 AIR QUALITY GUIDELINES • Dete
- Page 337 and 338:
326 AIR QUALITY GUIDELINES numbers
- Page 339 and 340:
328 AIR QUALITY GUIDELINES 26. Rich
- Page 341 and 342:
330 AIR QUALITY GUIDELINES 56. McCo
- Page 343 and 344:
332 AIR QUALITY GUIDELINES the comb
- Page 345 and 346:
334 AIR QUALITY GUIDELINES nitrogen
- Page 347 and 348:
336 AIR QUALITY GUIDELINES been exa
- Page 349 and 350:
338 AIR QUALITY GUIDELINES 20 days)
- Page 351 and 352:
340 AIR QUALITY GUIDELINES Table 1.
- Page 353 and 354:
342 Concentration (μg/m 3 ) 500 56
- Page 355 and 356:
344 Concentration (μg/m 3 ) 940 94
- Page 357 and 358:
346 AIR QUALITY GUIDELINES exposed
- Page 359 and 360:
348 AIR QUALITY GUIDELINES Host def
- Page 361 and 362:
350 AIR QUALITY GUIDELINES Table 2.
- Page 363 and 364:
352 AIR QUALITY GUIDELINES the few
- Page 365 and 366:
354 AIR QUALITY GUIDELINES 2005 (13
- Page 367 and 368:
356 AIR QUALITY GUIDELINES and carb
- Page 369 and 370:
358 AIR QUALITY GUIDELINES 10 μg/m
- Page 371 and 372:
360 AIR QUALITY GUIDELINES for othe
- Page 373 and 374:
362 AIR QUALITY GUIDELINES Table 3.
- Page 375 and 376:
364 AIR QUALITY GUIDELINES Table 4.
- Page 377 and 378:
366 AIR QUALITY GUIDELINES Table 5.
- Page 379 and 380:
368 AIR QUALITY GUIDELINES 38 ppb.
- Page 381 and 382:
370 AIR QUALITY GUIDELINES A popula
- Page 383 and 384:
372 AIR QUALITY GUIDELINES In summa
- Page 385 and 386:
374 AIR QUALITY GUIDELINES nitrogen
- Page 387 and 388:
376 AIR QUALITY GUIDELINES to nitro
- Page 389 and 390:
378 AIR QUALITY GUIDELINES 5. Advis
- Page 391 and 392:
380 AIR QUALITY GUIDELINES 28. Ichi
- Page 393 and 394:
382 AIR QUALITY GUIDELINES 57. Salo
- Page 395 and 396:
384 AIR QUALITY GUIDELINES 80. Koen
- Page 397 and 398:
386 AIR QUALITY GUIDELINES 107. Fra
- Page 399 and 400:
388 AIR QUALITY GUIDELINES 132. Lin
- Page 401 and 402:
390 AIR QUALITY GUIDELINES 160. Atk
- Page 403 and 404:
392 AIR QUALITY GUIDELINES 187. Fil
- Page 405 and 406:
394 AIR QUALITY GUIDELINES 215. Sam
- Page 407 and 408:
396 AIR QUALITY GUIDELINES Sources
- Page 409 and 410:
398 Health effects AIR QUALITY GUID
- Page 411 and 412:
400 AIR QUALITY GUIDELINES of airwa
- Page 413 and 414:
402 AIR QUALITY GUIDELINES discussi
- Page 415 and 416:
404 AIR QUALITY GUIDELINES the Cana
- Page 417 and 418:
406 AIR QUALITY GUIDELINES are a ca
- Page 419 and 420:
408 AIR QUALITY GUIDELINES In the A
- Page 421 and 422:
410 AIR QUALITY GUIDELINES pre-sele
- Page 423 and 424:
412 AIR QUALITY GUIDELINES duration
- Page 425 and 426:
414 AIR QUALITY GUIDELINES exposure
- Page 427 and 428:
416 AIR QUALITY GUIDELINES 4. Lawth
- Page 429 and 430:
418 AIR QUALITY GUIDELINES 30. Gryp
- Page 431 and 432:
420 AIR QUALITY GUIDELINES 55. Sega
- Page 434 and 435:
Annex 1 Pathogenesis of ozone-depen
- Page 436 and 437:
ANNEX 1 Thus, the following section
- Page 438 and 439:
ANNEX 1 system, an increase in the
- Page 440 and 441:
ANNEX 1 Increase in levels of nitri
- Page 442 and 443:
ANNEX 1 Induction of systemic infla
- Page 444 and 445:
ANNEX 1 Mechanisms of ozone toleran
- Page 446 and 447:
ANNEX 1 pulmonary alveolar macropha
- Page 448 and 449:
ANNEX 1 analysis in mice: tumour ne
- Page 450 and 451:
ANNEX 1 Effect Reference Increased
- Page 452 and 453:
ANNEX 1 Effect Reference Increase i
- Page 454 and 455:
ANNEX 1 Effect Reference Increased
- Page 456 and 457:
ANNEX 1 Effect Reference Exposures
- Page 458 and 459:
ANNEX 1 Observed effect Reference P
- Page 460 and 461:
ANNEX 1 Observed effect Reference O
- Page 462 and 463:
ANNEX 1 Observed effect Reference I
- Page 464 and 465:
ANNEX 1 Observed effect Reference O
- Page 466 and 467:
ANNEX 1 Observed effect Reference N
- Page 468 and 469:
ANNEX 1 Observed effect Reference N
- Page 470 and 471:
ANNEX 1 Observed effect Reference A
- Page 472 and 473:
ANNEX 1 34. Postlethwait EM et al.
- Page 474 and 475:
ANNEX 1 61. Krishna MT et al. Short
- Page 476 and 477:
ANNEX 1 87. Olin AC et al. Nitric o
- Page 478 and 479:
ANNEX 1 115. Schelegle ES et al. WC
- Page 480 and 481:
ANNEX 1 145. Eustis SL et al. Chron
- Page 482 and 483:
ANNEX 1 174. Shore SA et al. Ventil
- Page 484 and 485:
ANNEX 1 202. Blomberg A et al. Clar
- Page 486 and 487:
ANNEX 1 230. Schwartz J. Air pollut
- Page 488 and 489:
ANNEX 1 258. Mann JK et al. Air pol
- Page 490 and 491:
ANNEX 1 288. Conceicao GM et al. Ai
- Page 492 and 493:
Annex 2 List of Working Group membe
- Page 494 and 495:
ANNEX 2 Erich Wichmann GSF-Institut
- Page 496:
The WHO air quality guidelines offe