The National Study of Writing Instruction - University at Albany
The National Study of Writing Instruction - University at Albany
The National Study of Writing Instruction - University at Albany

Create successful ePaper yourself
Turn your PDF publications into a flip-book with our unique Google optimized e-Paper software.
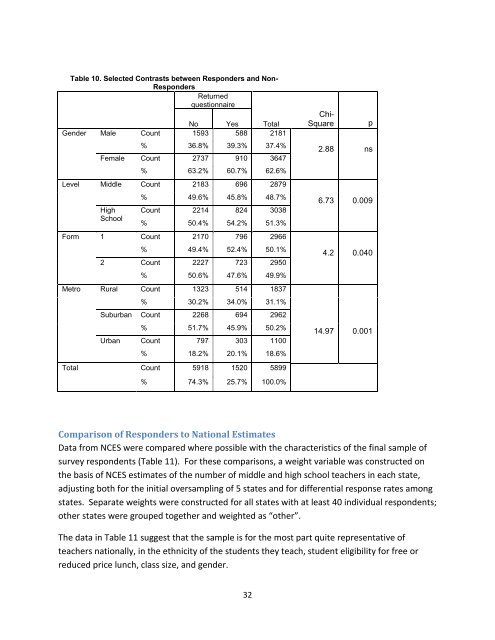
Table 10. Selected Contrasts between Responders and Non-<br />
Responders<br />
Returned<br />
questionnaire<br />
No Yes Total<br />
Gender Male Count 1593 588 2181<br />
% 36.8% 39.3% 37.4%<br />
Female Count 2737 910 3647<br />
% 63.2% 60.7% 62.6%<br />
Level Middle Count 2183 696 2879<br />
High<br />
School<br />
% 49.6% 45.8% 48.7%<br />
Count 2214 824 3038<br />
% 50.4% 54.2% 51.3%<br />
Form 1 Count 2170 796 2966<br />
% 49.4% 52.4% 50.1%<br />
2 Count 2227 723 2950<br />
% 50.6% 47.6% 49.9%<br />
Metro Rural Count 1323 514 1837<br />
% 30.2% 34.0% 31.1%<br />
Suburban Count 2268 694 2962<br />
% 51.7% 45.9% 50.2%<br />
Urban Count 797 303 1100<br />
% 18.2% 20.1% 18.6%<br />
Total Count 5918 1520 5899<br />
% 74.3% 25.7% 100.0%<br />
32<br />
Chi-<br />
Square p<br />
2.88 ns<br />
6.73 0.009<br />
4.2 0.040<br />
14.97 0.001<br />
Comparison <strong>of</strong> Responders to <strong>N<strong>at</strong>ional</strong> Estim<strong>at</strong>es<br />
D<strong>at</strong>a from NCES were compared where possible with the characteristics <strong>of</strong> the final sample <strong>of</strong><br />
survey respondents (Table 11). For these comparisons, a weight variable was constructed on<br />
the basis <strong>of</strong> NCES estim<strong>at</strong>es <strong>of</strong> the number <strong>of</strong> middle and high school teachers in each st<strong>at</strong>e,<br />
adjusting both for the initial oversampling <strong>of</strong> 5 st<strong>at</strong>es and for differential response r<strong>at</strong>es among<br />
st<strong>at</strong>es. Separ<strong>at</strong>e weights were constructed for all st<strong>at</strong>es with <strong>at</strong> least 40 individual respondents;<br />
other st<strong>at</strong>es were grouped together and weighted as “other”.<br />
<strong>The</strong> d<strong>at</strong>a in Table 11 suggest th<strong>at</strong> the sample is for the most part quite represent<strong>at</strong>ive <strong>of</strong><br />
teachers n<strong>at</strong>ionally, in the ethnicity <strong>of</strong> the students they teach, student eligibility for free or<br />
reduced price lunch, class size, and gender.