The National Study of Writing Instruction - University at Albany
The National Study of Writing Instruction - University at Albany
The National Study of Writing Instruction - University at Albany

Create successful ePaper yourself
Turn your PDF publications into a flip-book with our unique Google optimized e-Paper software.
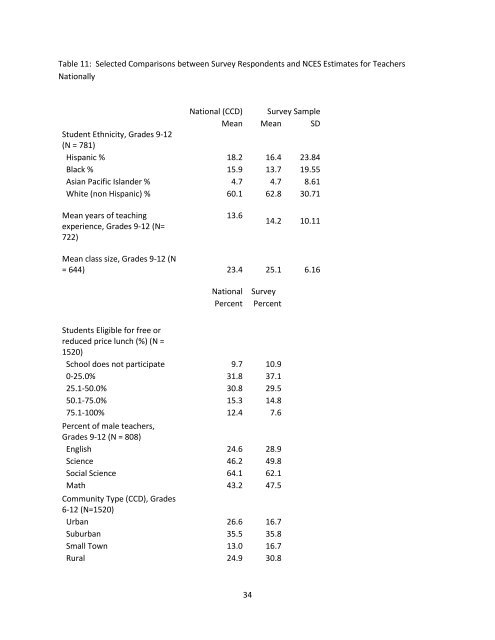
Table 11: Selected Comparisons between Survey Respondents and NCES Estim<strong>at</strong>es for Teachers<br />
<strong>N<strong>at</strong>ional</strong>ly<br />
<strong>N<strong>at</strong>ional</strong> (CCD) Survey Sample<br />
Mean Mean SD<br />
Student Ethnicity, Grades 9-12<br />
(N = 781)<br />
Hispanic % 18.2 16.4 23.84<br />
Black % 15.9 13.7 19.55<br />
Asian Pacific Islander % 4.7 4.7 8.61<br />
White (non Hispanic) % 60.1 62.8 30.71<br />
Mean years <strong>of</strong> teaching<br />
experience, Grades 9-12 (N=<br />
722)<br />
13.6<br />
34<br />
14.2 10.11<br />
Mean class size, Grades 9-12 (N<br />
= 644) 23.4 25.1 6.16<br />
<strong>N<strong>at</strong>ional</strong> Survey<br />
Percent Percent<br />
Students Eligible for free or<br />
reduced price lunch (%) (N =<br />
1520)<br />
School does not particip<strong>at</strong>e 9.7 10.9<br />
0-25.0% 31.8 37.1<br />
25.1-50.0% 30.8 29.5<br />
50.1-75.0% 15.3 14.8<br />
75.1-100% 12.4 7.6<br />
Percent <strong>of</strong> male teachers,<br />
Grades 9-12 (N = 808)<br />
English 24.6 28.9<br />
Science 46.2 49.8<br />
Social Science 64.1 62.1<br />
M<strong>at</strong>h 43.2 47.5<br />
Community Type (CCD), Grades<br />
6-12 (N=1520)<br />
Urban 26.6 16.7<br />
Suburban 35.5 35.8<br />
Small Town 13.0 16.7<br />
Rural 24.9 30.8