ST 520 Statistical Principles of Clinical Trials - NCSU Statistics ...
ST 520 Statistical Principles of Clinical Trials - NCSU Statistics ...
ST 520 Statistical Principles of Clinical Trials - NCSU Statistics ...

You also want an ePaper? Increase the reach of your titles
YUMPU automatically turns print PDFs into web optimized ePapers that Google loves.
CHAPTER 7 <strong>ST</strong> <strong>520</strong>, A. TSIATIS and D. Zhang<br />
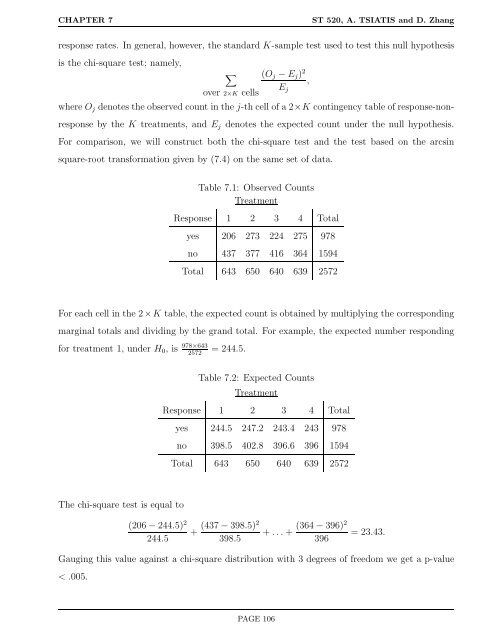
response rates. In general, however, the standard K-sample test used to test this null hypothesis<br />
is the chi-square test; namely,<br />
� (Oj − Ej)<br />
over 2×K cells<br />
2<br />
,<br />
Ej<br />
where Oj denotes the observed count in the j-th cell <strong>of</strong> a 2×K contingency table <strong>of</strong> response-non-<br />
response by the K treatments, and Ej denotes the expected count under the null hypothesis.<br />
For comparison, we will construct both the chi-square test and the test based on the arcsin<br />
square-root transformation given by (7.4) on the same set <strong>of</strong> data.<br />
Table 7.1: Observed Counts<br />
Treatment<br />
Response 1 2 3 4 Total<br />
yes 206 273 224 275 978<br />
no 437 377 416 364 1594<br />
Total 643 650 640 639 2572<br />
For each cell in the 2×K table, the expected count is obtained by multiplying the corresponding<br />
marginal totals and dividing by the grand total. For example, the expected number responding<br />
for treatment 1, under H0, is 978×643<br />
2572<br />
The chi-square test is equal to<br />
= 244.5.<br />
Table 7.2: Expected Counts<br />
Treatment<br />
Response 1 2 3 4 Total<br />
(206 − 244.5) 2<br />
+<br />
244.5<br />
(437 − 398.5)2<br />
yes 244.5 247.2 243.4 243 978<br />
no 398.5 402.8 396.6 396 1594<br />
Total 643 650 640 639 2572<br />
398.5<br />
+ . . . +<br />
(364 − 396)2<br />
396<br />
= 23.43.<br />
Gauging this value against a chi-square distribution with 3 degrees <strong>of</strong> freedom we get a p-value<br />
< .005.<br />
PAGE 106