ST 520 Statistical Principles of Clinical Trials - NCSU Statistics ...
ST 520 Statistical Principles of Clinical Trials - NCSU Statistics ...
ST 520 Statistical Principles of Clinical Trials - NCSU Statistics ...

You also want an ePaper? Increase the reach of your titles
YUMPU automatically turns print PDFs into web optimized ePapers that Google loves.
CHAPTER 6 <strong>ST</strong> <strong>520</strong>, A. TSIATIS and D. Zhang<br />
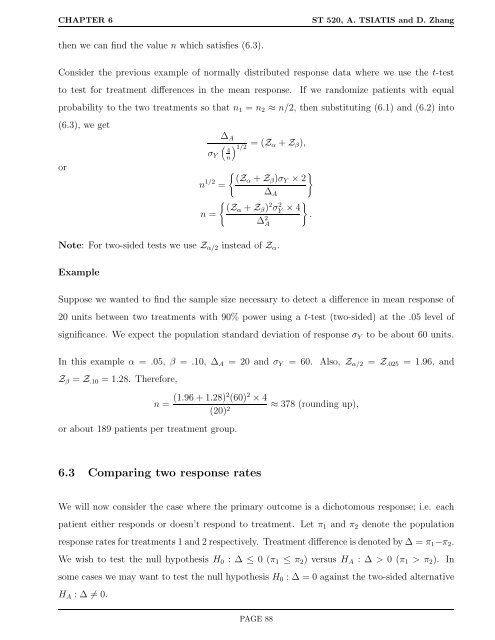
then we can find the value n which satisfies (6.3).<br />
Consider the previous example <strong>of</strong> normally distributed response data where we use the t-test<br />
to test for treatment differences in the mean response. If we randomize patients with equal<br />
probability to the two treatments so that n1 = n2 ≈ n/2, then substituting (6.1) and (6.2) into<br />
(6.3), we get<br />
or<br />
∆A<br />
�<br />
4<br />
σY n<br />
n 1/2 =<br />
n =<br />
� 1/2 = (Zα + Zβ),<br />
� �<br />
(Zα + Zβ)σY × 2<br />
∆A<br />
� (Zα + Zβ) 2 σ 2 Y<br />
∆ 2 A<br />
Note: For two-sided tests we use Zα/2 instead <strong>of</strong> Zα.<br />
Example<br />
�<br />
× 4<br />
.<br />
Suppose we wanted to find the sample size necessary to detect a difference in mean response <strong>of</strong><br />
20 units between two treatments with 90% power using a t-test (two-sided) at the .05 level <strong>of</strong><br />
significance. We expect the population standard deviation <strong>of</strong> response σY to be about 60 units.<br />
In this example α = .05, β = .10, ∆A = 20 and σY = 60. Also, Zα/2 = Z.025 = 1.96, and<br />
Zβ = Z.10 = 1.28. Therefore,<br />
n = (1.96 + 1.28)2 (60) 2 × 4<br />
(20) 2<br />
or about 189 patients per treatment group.<br />
6.3 Comparing two response rates<br />
≈ 378 (rounding up),<br />
We will now consider the case where the primary outcome is a dichotomous response; i.e. each<br />
patient either responds or doesn’t respond to treatment. Let π1 and π2 denote the population<br />
response rates for treatments 1 and 2 respectively. Treatment difference is denoted by ∆ = π1−π2.<br />
We wish to test the null hypothesis H0 : ∆ ≤ 0 (π1 ≤ π2) versus HA : ∆ > 0 (π1 > π2). In<br />
some cases we may want to test the null hypothesis H0 : ∆ = 0 against the two-sided alternative<br />
HA : ∆ �= 0.<br />
PAGE 88