ST 520 Statistical Principles of Clinical Trials - NCSU Statistics ...
ST 520 Statistical Principles of Clinical Trials - NCSU Statistics ...
ST 520 Statistical Principles of Clinical Trials - NCSU Statistics ...

Create successful ePaper yourself
Turn your PDF publications into a flip-book with our unique Google optimized e-Paper software.
CHAPTER 6 <strong>ST</strong> <strong>520</strong>, A. TSIATIS and D. Zhang<br />
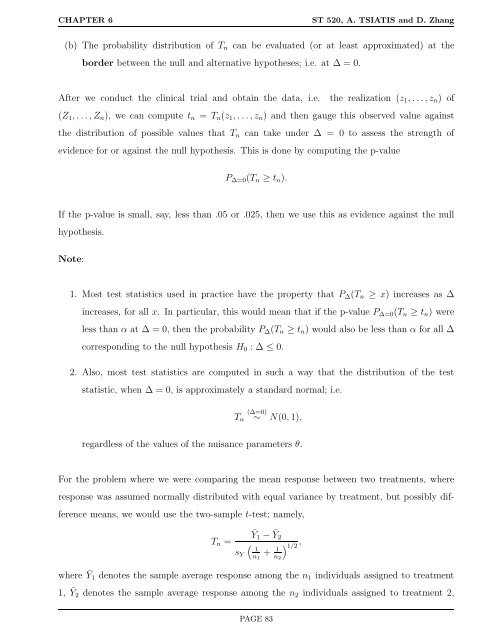
(b) The probability distribution <strong>of</strong> Tn can be evaluated (or at least approximated) at the<br />
border between the null and alternative hypotheses; i.e. at ∆ = 0.<br />
After we conduct the clinical trial and obtain the data, i.e. the realization (z1, . . .,zn) <strong>of</strong><br />
(Z1, . . .,Zn), we can compute tn = Tn(z1, . . .,zn) and then gauge this observed value against<br />
the distribution <strong>of</strong> possible values that Tn can take under ∆ = 0 to assess the strength <strong>of</strong><br />
evidence for or against the null hypothesis. This is done by computing the p-value<br />
P∆=0(Tn ≥ tn).<br />
If the p-value is small, say, less than .05 or .025, then we use this as evidence against the null<br />
hypothesis.<br />
Note:<br />
1. Most test statistics used in practice have the property that P∆(Tn ≥ x) increases as ∆<br />
increases, for all x. In particular, this would mean that if the p-value P∆=0(Tn ≥ tn) were<br />
less than α at ∆ = 0, then the probability P∆(Tn ≥ tn) would also be less than α for all ∆<br />
corresponding to the null hypothesis H0 : ∆ ≤ 0.<br />
2. Also, most test statistics are computed in such a way that the distribution <strong>of</strong> the test<br />
statistic, when ∆ = 0, is approximately a standard normal; i.e.<br />
Tn<br />
(∆=0)<br />
∼ N(0, 1),<br />
regardless <strong>of</strong> the values <strong>of</strong> the nuisance parameters θ.<br />
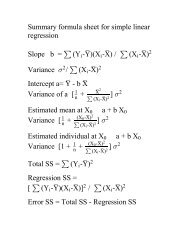
For the problem where we were comparing the mean response between two treatments, where<br />
response was assumed normally distributed with equal variance by treatment, but possibly dif-<br />
ference means, we would use the two-sample t-test; namely,<br />
Tn =<br />
sY<br />
¯Y1 − ¯ Y2<br />
� , 1/2<br />
1<br />
+ n1 n2<br />
� 1<br />
where ¯ Y1 denotes the sample average response among the n1 individuals assigned to treatment<br />
1, ¯ Y2 denotes the sample average response among the n2 individuals assigned to treatment 2,<br />
PAGE 83