Through-Wall Imaging With UWB Radar System - KEMT FEI TUKE
Through-Wall Imaging With UWB Radar System - KEMT FEI TUKE
Through-Wall Imaging With UWB Radar System - KEMT FEI TUKE

You also want an ePaper? Increase the reach of your titles
YUMPU automatically turns print PDFs into web optimized ePapers that Google loves.
4.4 Measurements of the Practical Scenarios 80<br />
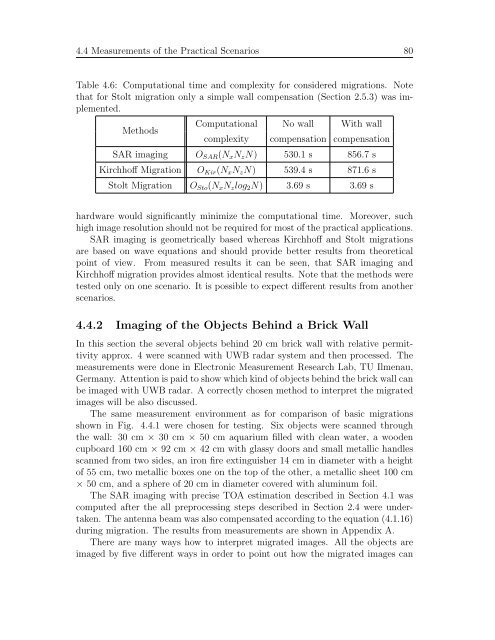
Table 4.6: Computational time and complexity for considered migrations. Note<br />
that for Stolt migration only a simple wall compensation (Section 2.5.3) was implemented.<br />
Methods<br />
Computational No wall <strong>With</strong> wall<br />
complexity compensation compensation<br />
SAR imaging OSAR(NxNzN) 530.1 s 856.7 s<br />
Kirchhoff Migration OKir(NxNzN) 539.4 s 871.6 s<br />
Stolt Migration OSto(NxNzlog2N) 3.69 s 3.69 s<br />
hardware would significantly minimize the computational time. Moreover, such<br />
high image resolution should not be required for most of the practical applications.<br />
SAR imaging is geometrically based whereas Kirchhoff and Stolt migrations<br />
are based on wave equations and should provide better results from theoretical<br />
point of view. From measured results it can be seen, that SAR imaging and<br />
Kirchhoff migration provides almost identical results. Note that the methods were<br />
tested only on one scenario. It is possible to expect different results from another<br />
scenarios.<br />
4.4.2 <strong>Imaging</strong> of the Objects Behind a Brick <strong>Wall</strong><br />
In this section the several objects behind 20 cm brick wall with relative permittivity<br />
approx. 4 were scanned with <strong>UWB</strong> radar system and then processed. The<br />
measurements were done in Electronic Measurement Research Lab, TU Ilmenau,<br />
Germany. Attention is paid to show which kind of objects behind the brick wall can<br />
be imaged with <strong>UWB</strong> radar. A correctly chosen method to interpret the migrated<br />
images will be also discussed.<br />
The same measurement environment as for comparison of basic migrations<br />
shown in Fig. 4.4.1 were chosen for testing. Six objects were scanned through<br />
the wall: 30 cm × 30 cm × 50 cm aquarium filled with clean water, a wooden<br />
cupboard 160 cm × 92 cm × 42 cm with glassy doors and small metallic handles<br />
scanned from two sides, an iron fire extinguisher 14 cm in diameter with a height<br />
of 55 cm, two metallic boxes one on the top of the other, a metallic sheet 100 cm<br />
× 50 cm, and a sphere of 20 cm in diameter covered with aluminum foil.<br />
The SAR imaging with precise TOA estimation described in Section 4.1 was<br />
computed after the all preprocessing steps described in Section 2.4 were undertaken.<br />
The antenna beam was also compensated according to the equation (4.1.16)<br />
during migration. The results from measurements are shown in Appendix A.<br />
There are many ways how to interpret migrated images. All the objects are<br />
imaged by five different ways in order to point out how the migrated images can