Sediment Quality in Puget Sound Year 2 - Center for Coastal ...
Sediment Quality in Puget Sound Year 2 - Center for Coastal ...
Sediment Quality in Puget Sound Year 2 - Center for Coastal ...
Create successful ePaper yourself
Turn your PDF publications into a flip-book with our unique Google optimized e-Paper software.
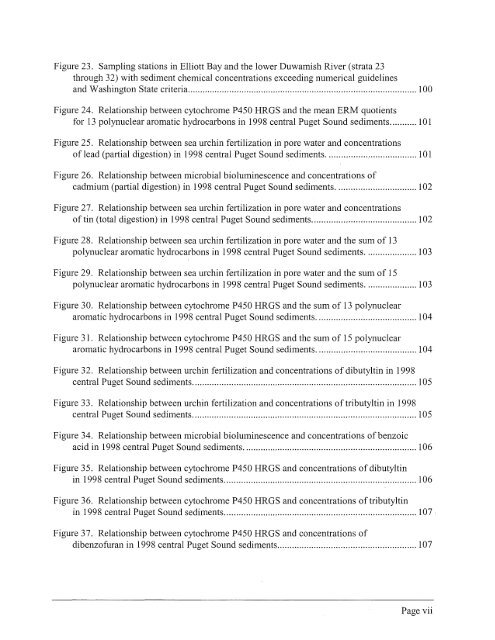
Figure 23. Sampl<strong>in</strong>g stations <strong>in</strong> Elliott Bay and the lower Duwamish River (strata 23<br />
through 32) with sediment chemical concentrations exceed<strong>in</strong>g numerical guidel<strong>in</strong>es<br />
. .<br />
and Wash<strong>in</strong>gton State criteria .............................................................................................. 100<br />
Figure 24. Relationship between cytochrome P450 HRGS and the mean ERM quotients<br />
<strong>for</strong> 13 polynuclear aromatic hydrocarbons <strong>in</strong> 1998 central <strong>Puget</strong> <strong>Sound</strong> sediments.. .. . . .. . .. 10 1<br />
Figure 25. Relationship between sea urch<strong>in</strong> fertilization <strong>in</strong> pore water and concentrations<br />
of lead (partial digestion) <strong>in</strong> 1998 central <strong>Puget</strong> <strong>Sound</strong> sediments. .................................... 101<br />
Figure 26. Relationship between microbial biolum<strong>in</strong>escence and concentrations of<br />
cadmium (partial digestion) <strong>in</strong> 1998 central <strong>Puget</strong> <strong>Sound</strong> sediments. ................................ 102<br />
Figure 27. Relationship between sea urch<strong>in</strong> fertilization <strong>in</strong> pore water and concentrations<br />
of t<strong>in</strong> (total digestion) <strong>in</strong> 1998 central <strong>Puget</strong> <strong>Sound</strong> sediments ........................................... 102<br />
Figure 28. Relationship between sea urch<strong>in</strong> fertilization <strong>in</strong> pore water and the sum of 13<br />
polynuclear aromatic hydrocarbons <strong>in</strong> 1998 central <strong>Puget</strong> <strong>Sound</strong> sediments. .................... 103<br />
Figure 29. Relationship between sea urch<strong>in</strong> fertilization <strong>in</strong> pore water and the sum of 15<br />
polynuclear aromatic hydrocarbons <strong>in</strong> 1998 central <strong>Puget</strong> <strong>Sound</strong> sediments. .................... 103<br />
Figure 30. Relationship between cytochrome P450 HRGS and the sum of 13 polynuclear<br />
aromatic hydrocarbons <strong>in</strong> 1998 central <strong>Puget</strong> <strong>Sound</strong> sediments. . ....................................... 104<br />
Figure 3 1. Relationship between cytochrome P450 HRGS and the sum of 15 polynuclear<br />
aromatic hydrocarbons <strong>in</strong> 1998 central <strong>Puget</strong> <strong>Sound</strong> sediments. ........................................ 104<br />
Figure 32. Relationship between urch<strong>in</strong> fertilization and concentrations of dibutylt<strong>in</strong> <strong>in</strong> 1998<br />
central <strong>Puget</strong> <strong>Sound</strong> sediments. ........................................................................................ ... 105<br />
Figure 33. Relationship between urch<strong>in</strong> fertilization and concentrations of tributylt<strong>in</strong> <strong>in</strong> 1998<br />
central <strong>Puget</strong> <strong>Sound</strong> sediments. ........................................................................................... 105<br />
Figure 34. Relationship between microbial biolum<strong>in</strong>escence and concentrations of benzoic<br />
acid <strong>in</strong> 1998 central <strong>Puget</strong> <strong>Sound</strong> sediments. ...................................................................... 106<br />
Figure 35. Relationship between cytochrome P450 HRGS and concentrations of dibutylt<strong>in</strong><br />
<strong>in</strong> 1998 central <strong>Puget</strong> <strong>Sound</strong> sediments ............................................................................... 106<br />
Figure 36. Relationship between cytochrome P450 HRGS and concentrations of tributylt<strong>in</strong><br />
<strong>in</strong> 1998 central <strong>Puget</strong> <strong>Sound</strong> sediments ............................................................................... 107<br />
Figure 37. Relationship between cytochrome P450 HRGS and concentrations of<br />
dibenzofuran <strong>in</strong> 1998 central <strong>Puget</strong> <strong>Sound</strong> sediments ......................................................... 107<br />
Page vii


