

Upscaling and Inverse Modeling of Groundwater Flow and Mass ...
Upscaling and Inverse Modeling of Groundwater Flow and Mass ...
Upscaling and Inverse Modeling of Groundwater Flow and Mass ...

Create successful ePaper yourself
Turn your PDF publications into a flip-book with our unique Google optimized e-Paper software.
CHAPTER 5. JOINTLY MAPPING HYDRAULIC . . . 125<br />
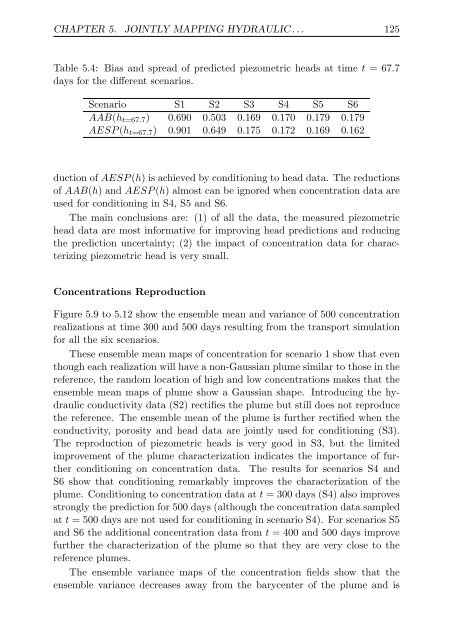
Table 5.4: Bias <strong>and</strong> spread <strong>of</strong> predicted piezometric heads at time t = 67.7<br />
days for the different scenarios.<br />
Scenario S1 S2 S3 S4 S5 S6<br />
AAB(ht=67.7) 0.690 0.503 0.169 0.170 0.179 0.179<br />
AESP (ht=67.7) 0.901 0.649 0.175 0.172 0.169 0.162<br />
duction <strong>of</strong> AESP (h) is achieved by conditioning to head data. The reductions<br />
<strong>of</strong> AAB(h) <strong>and</strong> AESP (h) almost can be ignored when concentration data are<br />
used for conditioning in S4, S5 <strong>and</strong> S6.<br />
The main conclusions are: (1) <strong>of</strong> all the data, the measured piezometric<br />
head data are most informative for improving head predictions <strong>and</strong> reducing<br />
the prediction uncertainty; (2) the impact <strong>of</strong> concentration data for characterizing<br />
piezometric head is very small.<br />
Concentrations Reproduction<br />
Figure 5.9 to 5.12 show the ensemble mean <strong>and</strong> variance <strong>of</strong> 500 concentration<br />
realizations at time 300 <strong>and</strong> 500 days resulting from the transport simulation<br />
for all the six scenarios.<br />
These ensemble mean maps <strong>of</strong> concentration for scenario 1 show that even<br />
though each realization will have a non-Gaussian plume similar to those in the<br />
reference, the r<strong>and</strong>om location <strong>of</strong> high <strong>and</strong> low concentrations makes that the<br />
ensemble mean maps <strong>of</strong> plume show a Gaussian shape. Introducing the hydraulic<br />
conductivity data (S2) rectifies the plume but still does not reproduce<br />
the reference. The ensemble mean <strong>of</strong> the plume is further rectified when the<br />
conductivity, porosity <strong>and</strong> head data are jointly used for conditioning (S3).<br />
The reproduction <strong>of</strong> piezometric heads is very good in S3, but the limited<br />
improvement <strong>of</strong> the plume characterization indicates the importance <strong>of</strong> further<br />
conditioning on concentration data. The results for scenarios S4 <strong>and</strong><br />
S6 show that conditioning remarkably improves the characterization <strong>of</strong> the<br />
plume. Conditioning to concentration data at t = 300 days (S4) also improves<br />
strongly the prediction for 500 days (although the concentration data sampled<br />
at t = 500 days are not used for conditioning in scenario S4). For scenarios S5<br />
<strong>and</strong> S6 the additional concentration data from t = 400 <strong>and</strong> 500 days improve<br />
further the characterization <strong>of</strong> the plume so that they are very close to the<br />
reference plumes.<br />
The ensemble variance maps <strong>of</strong> the concentration fields show that the<br />
ensemble variance decreases away from the barycenter <strong>of</strong> the plume <strong>and</strong> is