

Upscaling and Inverse Modeling of Groundwater Flow and Mass ...
Upscaling and Inverse Modeling of Groundwater Flow and Mass ...
Upscaling and Inverse Modeling of Groundwater Flow and Mass ...

Create successful ePaper yourself
Turn your PDF publications into a flip-book with our unique Google optimized e-Paper software.
CHAPTER 2. A COMPARATIVE STUDY OF THREE- . . . 29<br />
Normalized <strong>Mass</strong><br />
1<br />
0.1<br />
0.01<br />
0.001<br />
0 50 100 150 200 250<br />
Downstream Distance [m]<br />
<strong>Mass</strong> distribution t=27 days<br />
Realization #26<br />
Laplacian with skin (interblock)<br />
Simple Laplacian (interblock)<br />
Simple Laplacian (block)<br />
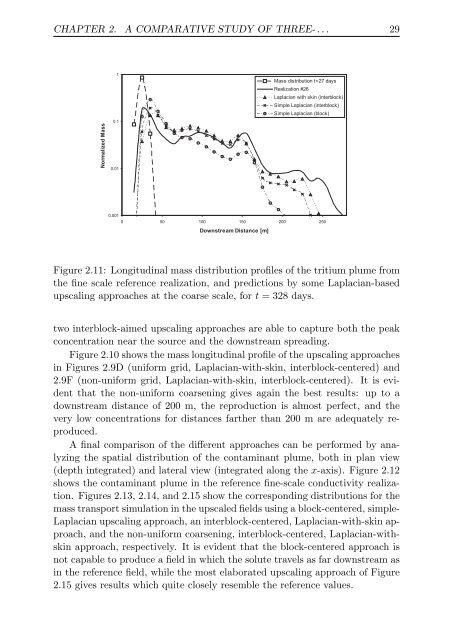
Figure 2.11: Longitudinal mass distribution pr<strong>of</strong>iles <strong>of</strong> the tritium plume from<br />
the fine scale reference realization, <strong>and</strong> predictions by some Laplacian-based<br />
upscaling approaches at the coarse scale, for t = 328 days.<br />
two interblock-aimed upscaling approaches are able to capture both the peak<br />
concentration near the source <strong>and</strong> the downstream spreading.<br />
Figure 2.10 shows the mass longitudinal pr<strong>of</strong>ile <strong>of</strong> the upscaling approaches<br />
in Figures 2.9D (uniform grid, Laplacian-with-skin, interblock-centered) <strong>and</strong><br />
2.9F (non-uniform grid, Laplacian-with-skin, interblock-centered). It is evident<br />
that the non-uniform coarsening gives again the best results: up to a<br />
downstream distance <strong>of</strong> 200 m, the reproduction is almost perfect, <strong>and</strong> the<br />
very low concentrations for distances farther than 200 m are adequately reproduced.<br />
A final comparison <strong>of</strong> the different approaches can be performed by analyzing<br />
the spatial distribution <strong>of</strong> the contaminant plume, both in plan view<br />
(depth integrated) <strong>and</strong> lateral view (integrated along the x-axis). Figure 2.12<br />
shows the contaminant plume in the reference fine-scale conductivity realization.<br />
Figures 2.13, 2.14, <strong>and</strong> 2.15 show the corresponding distributions for the<br />
mass transport simulation in the upscaled fields using a block-centered, simple-<br />
Laplacian upscaling approach, an interblock-centered, Laplacian-with-skin approach,<br />
<strong>and</strong> the non-uniform coarsening, interblock-centered, Laplacian-withskin<br />
approach, respectively. It is evident that the block-centered approach is<br />
not capable to produce a field in which the solute travels as far downstream as<br />
in the reference field, while the most elaborated upscaling approach <strong>of</strong> Figure<br />
2.15 gives results which quite closely resemble the reference values.