

Upscaling and Inverse Modeling of Groundwater Flow and Mass ...
Upscaling and Inverse Modeling of Groundwater Flow and Mass ...
Upscaling and Inverse Modeling of Groundwater Flow and Mass ...

You also want an ePaper? Increase the reach of your titles
YUMPU automatically turns print PDFs into web optimized ePapers that Google loves.
60 CHAPTER 3. TRANSPORT UPSCALING USING MULTI- . . .<br />
Normalized Concentration<br />
Normalized Concentration<br />
Normalized Concentration<br />
1<br />
0.8<br />
0.6<br />
0.4<br />
0.2<br />
Travel distance: 10 m<br />
180 x 120 x 60, Fine<br />
18 x 12 x 12, Coarse: advection-only<br />
18 x 12 x 12, Coarse: double-rate Model<br />
0<br />
0 100 200 300 400 500 600<br />
1<br />
0.8<br />
0.6<br />
0.4<br />
0.2<br />
Time [day]<br />
0<br />
0 200 400 600 800 1000<br />
1<br />
0.8<br />
0.6<br />
0.4<br />
0.2<br />
Travel distance: 50 m<br />
180 x 120 x 60, Fine<br />
18 x 12 x 12, Coarse: advection-only<br />
18 x 12 x 12, Coarse: double-rate Model<br />
Time [day]<br />
Travel distance: 90 m<br />
180 x 120 x 60, Fine<br />
18 x 12 x 12, Coarse: advection-only<br />
18 x 12 x 12, Coarse: double-rate Model<br />
0<br />
0 200 400 600 800 1000<br />
Time [day]<br />
Normalized Concentration<br />
Normalized Concentration<br />
Normalized Concentration<br />
1<br />
0.8<br />
0.6<br />
0.4<br />
0.2<br />
Travel distance: 30 m<br />
180 x 120 x 60, Fine<br />
18 x 12 x 12, Coarse: advection-only<br />
18 x 12 x 12, Coarse: double-rate Model<br />
0<br />
0 200 400 600 800 1000<br />
1<br />
0.8<br />
0.6<br />
0.4<br />
0.2<br />
Time [day]<br />
Travel distance: 70 m<br />
180 x 120 x 60, Fine<br />
18 x 12 x 12, Coarse: advection-only<br />
18 x 12 x 12, Coarse: double-rate Model<br />
0<br />
0 200 400 600 800 1000<br />
1<br />
0.8<br />
0.6<br />
0.4<br />
0.2<br />
Time [day]<br />
Travel distance: 130 m<br />
180 x 120 x 60, Fine<br />
18 x 12 x 12, Coarse: advection-only<br />
18 x 12 x 12, Coarse: double-rate Model<br />
0<br />
0 200 400 600 800 1000<br />
Time [day]<br />
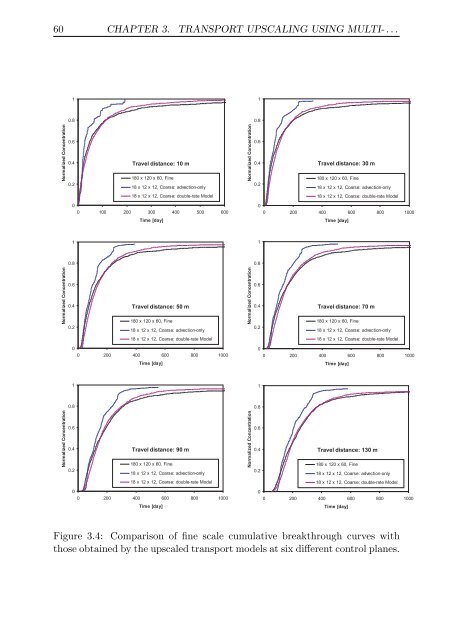
Figure 3.4: Comparison <strong>of</strong> fine scale cumulative breakthrough curves with<br />
those obtained by the upscaled transport models at six different control planes.