- Page 1:
Upscaling and Inverse Modeling of G
- Page 4 and 5:
c⃝ Copyright by Liangping Li 2011
- Page 7 and 8: Abstract The need to reduce the com
- Page 9 and 10: improved as more data is assimilate
- Page 11 and 12: Resumen La necesidad de reducir el
- Page 13 and 14: Por último, en el tercer bloque, e
- Page 15 and 16: Resum La necessitat de reduir el co
- Page 17 and 18: flux i el transport (conductivitat
- Page 19: Acknowledgements I want to thank my
- Page 22 and 23: xx CONTENTS 3 Transport Upscaling U
- Page 24 and 25: xxii CONTENTS
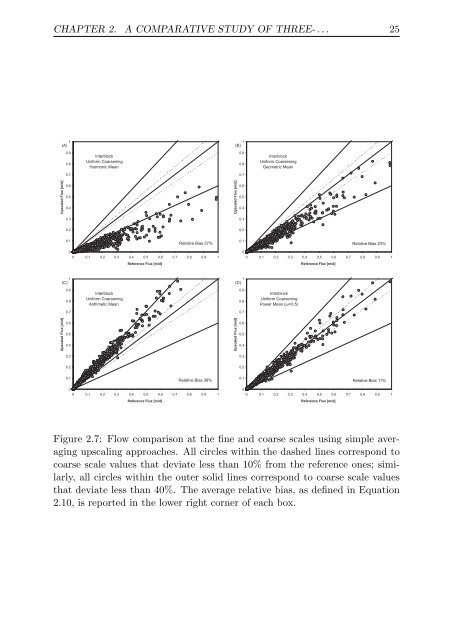
- Page 26 and 27: xxiv LIST OF FIGURES 2.7 Flow compa
- Page 28 and 29: xxvi LIST OF FIGURES 4.4 Reference
- Page 30 and 31: xxviii LIST OF FIGURES
- Page 33 and 34: 1.1 Motivation and Objectives 1 Int
- Page 35: CHAPTER 1. INTRODUCTION 3 Chapter 2
- Page 38 and 39: 6 CHAPTER 2. A COMPARATIVE STUDY OF
- Page 40 and 41: 8 CHAPTER 2. A COMPARATIVE STUDY OF
- Page 42 and 43: 10 CHAPTER 2. A COMPARATIVE STUDY O
- Page 44 and 45: 12 CHAPTER 2. A COMPARATIVE STUDY O
- Page 46 and 47: 14 CHAPTER 2. A COMPARATIVE STUDY O
- Page 48 and 49: 16 CHAPTER 2. A COMPARATIVE STUDY O
- Page 50 and 51: 18 CHAPTER 2. A COMPARATIVE STUDY O
- Page 52 and 53: 20 CHAPTER 2. A COMPARATIVE STUDY O
- Page 54 and 55: 22 CHAPTER 2. A COMPARATIVE STUDY O
- Page 58 and 59: 26 CHAPTER 2. A COMPARATIVE STUDY O
- Page 60 and 61: 28 CHAPTER 2. A COMPARATIVE STUDY O
- Page 62 and 63: 30 CHAPTER 2. A COMPARATIVE STUDY O
- Page 64 and 65: 32 CHAPTER 2. A COMPARATIVE STUDY O
- Page 66 and 67: 34 CHAPTER 2. A COMPARATIVE STUDY O
- Page 68 and 69: 36 CHAPTER 2. A COMPARATIVE STUDY O
- Page 70 and 71: 38 BIBLIOGRAPHY Berkowitz, B., Sche
- Page 72 and 73: 40 BIBLIOGRAPHY Gómez-Hernández,
- Page 74 and 75: 42 BIBLIOGRAPHY Salamon, P., Fernà
- Page 76 and 77: 44 CHAPTER 3. TRANSPORT UPSCALING U
- Page 78 and 79: 46 CHAPTER 3. TRANSPORT UPSCALING U
- Page 80 and 81: 48 CHAPTER 3. TRANSPORT UPSCALING U
- Page 82 and 83: 50 CHAPTER 3. TRANSPORT UPSCALING U
- Page 84 and 85: 52 CHAPTER 3. TRANSPORT UPSCALING U
- Page 86 and 87: 54 CHAPTER 3. TRANSPORT UPSCALING U
- Page 88 and 89: 56 CHAPTER 3. TRANSPORT UPSCALING U
- Page 90 and 91: 58 CHAPTER 3. TRANSPORT UPSCALING U
- Page 92 and 93: 60 CHAPTER 3. TRANSPORT UPSCALING U
- Page 94 and 95: 62 CHAPTER 3. TRANSPORT UPSCALING U
- Page 96 and 97: 64 CHAPTER 3. TRANSPORT UPSCALING U
- Page 98 and 99: 66 CHAPTER 3. TRANSPORT UPSCALING U
- Page 100 and 101: 68 CHAPTER 3. TRANSPORT UPSCALING U
- Page 102 and 103: 70 BIBLIOGRAPHY Dagan, G., 1994. Up
- Page 104 and 105: 72 BIBLIOGRAPHY Lawrence, A. E., Sa
- Page 106 and 107:
74 BIBLIOGRAPHY Zhang, Y., 2004. Up
- Page 108 and 109:
76 CHAPTER 4. MODELING TRANSIENT GR
- Page 110 and 111:
78 CHAPTER 4. MODELING TRANSIENT GR
- Page 112 and 113:
80 CHAPTER 4. MODELING TRANSIENT GR
- Page 114 and 115:
82 CHAPTER 4. MODELING TRANSIENT GR
- Page 116 and 117:
84 CHAPTER 4. MODELING TRANSIENT GR
- Page 118 and 119:
86 CHAPTER 4. MODELING TRANSIENT GR
- Page 120 and 121:
88 CHAPTER 4. MODELING TRANSIENT GR
- Page 122 and 123:
90 CHAPTER 4. MODELING TRANSIENT GR
- Page 124 and 125:
92 CHAPTER 4. MODELING TRANSIENT GR
- Page 126 and 127:
94 CHAPTER 4. MODELING TRANSIENT GR
- Page 128 and 129:
96 CHAPTER 4. MODELING TRANSIENT GR
- Page 130 and 131:
98 CHAPTER 4. MODELING TRANSIENT GR
- Page 132 and 133:
100 CHAPTER 4. MODELING TRANSIENT G
- Page 134 and 135:
102 BIBLIOGRAPHY Durlofsky, L. J.,
- Page 136 and 137:
104 BIBLIOGRAPHY Tran, T., 1996. Th
- Page 138 and 139:
106 CHAPTER 5. JOINTLY MAPPING HYDR
- Page 140 and 141:
108 CHAPTER 5. JOINTLY MAPPING HYDR
- Page 142 and 143:
110 CHAPTER 5. JOINTLY MAPPING HYDR
- Page 144 and 145:
112 CHAPTER 5. JOINTLY MAPPING HYDR
- Page 146 and 147:
114 CHAPTER 5. JOINTLY MAPPING HYDR
- Page 148 and 149:
116 CHAPTER 5. JOINTLY MAPPING HYDR
- Page 150 and 151:
118 CHAPTER 5. JOINTLY MAPPING HYDR
- Page 152 and 153:
120 CHAPTER 5. JOINTLY MAPPING HYDR
- Page 154 and 155:
122 CHAPTER 5. JOINTLY MAPPING HYDR
- Page 156 and 157:
124 CHAPTER 5. JOINTLY MAPPING HYDR
- Page 158 and 159:
126 CHAPTER 5. JOINTLY MAPPING HYDR
- Page 160 and 161:
128 CHAPTER 5. JOINTLY MAPPING HYDR
- Page 162 and 163:
130 CHAPTER 5. JOINTLY MAPPING HYDR
- Page 164 and 165:
132 CHAPTER 5. JOINTLY MAPPING HYDR
- Page 166 and 167:
134 CHAPTER 5. JOINTLY MAPPING HYDR
- Page 168 and 169:
136 BIBLIOGRAPHY Chen, Y., Zhang, D
- Page 170 and 171:
138 BIBLIOGRAPHY Journel, A., 1974.
- Page 172 and 173:
140 BIBLIOGRAPHY Wen, X., Deutsch,
- Page 174 and 175:
142 CHAPTER 6. GROUNDWATER FLOW INV
- Page 176 and 177:
144 CHAPTER 6. GROUNDWATER FLOW INV
- Page 178 and 179:
146 CHAPTER 6. GROUNDWATER FLOW INV
- Page 180 and 181:
148 CHAPTER 6. GROUNDWATER FLOW INV
- Page 182 and 183:
150 CHAPTER 6. GROUNDWATER FLOW INV
- Page 184 and 185:
152 CHAPTER 6. GROUNDWATER FLOW INV
- Page 186 and 187:
154 CHAPTER 6. GROUNDWATER FLOW INV
- Page 188 and 189:
156 CHAPTER 6. GROUNDWATER FLOW INV
- Page 190 and 191:
158 CHAPTER 6. GROUNDWATER FLOW INV
- Page 192 and 193:
160 CHAPTER 6. GROUNDWATER FLOW INV
- Page 194 and 195:
162 CHAPTER 6. GROUNDWATER FLOW INV
- Page 196 and 197:
164 CHAPTER 6. GROUNDWATER FLOW INV
- Page 198 and 199:
166 CHAPTER 6. GROUNDWATER FLOW INV
- Page 200 and 201:
168 CHAPTER 6. GROUNDWATER FLOW INV
- Page 202 and 203:
170 BIBLIOGRAPHY Deutsch, C. V., Jo
- Page 204 and 205:
172 BIBLIOGRAPHY Lee, S., Carle, S.
- Page 206 and 207:
174 BIBLIOGRAPHY Yeh, W., 1986. Rev
- Page 208 and 209:
176 CHAPTER 7. CONCLUSIONS travels
- Page 210 and 211:
178 CHAPTER 7. CONCLUSIONS predicti
- Page 212 and 213:
180 APPENDIX A. FLOWXYZ3D - A THREE
- Page 214:
182 APPENDIX A. FLOWXYZ3D - A THREE