

Untitled - Tractat de l'aigua
Untitled - Tractat de l'aigua
Untitled - Tractat de l'aigua

You also want an ePaper? Increase the reach of your titles
YUMPU automatically turns print PDFs into web optimized ePapers that Google loves.
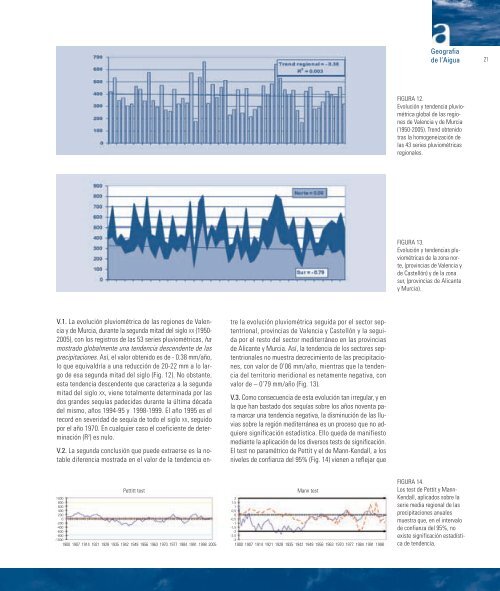
V.1. La evolución pluviométrica <strong>de</strong> las regiones <strong>de</strong> Valencia<br />
y <strong>de</strong> Murcia, durante la segunda mitad <strong>de</strong>l siglo XX (1950-<br />
2005), con los registros <strong>de</strong> las 53 series pluviométricas, ha<br />
mostrado globalmente una ten<strong>de</strong>ncia <strong>de</strong>scen<strong>de</strong>nte <strong>de</strong> las<br />
precipitaciones. Así, el valor obtenido es <strong>de</strong> - 0.38 mm/año,<br />
lo que equivaldría a una reducción <strong>de</strong> 20-22 mm a lo largo<br />
<strong>de</strong> esa segunda mitad <strong>de</strong>l siglo (Fig. 12). No obstante,<br />
esta ten<strong>de</strong>ncia <strong>de</strong>scen<strong>de</strong>nte que caracteriza a la segunda<br />
mitad <strong>de</strong>l siglo XX, viene totalmente <strong>de</strong>terminada por las<br />
dos gran<strong>de</strong>s sequías pa<strong>de</strong>cidas durante la última década<br />
<strong>de</strong>l mismo, años 1994-95 y 1998-1999. El año 1995 es el<br />
record en severidad <strong>de</strong> sequía <strong>de</strong> todo el siglo XX, seguido<br />
por el año 1970. En cualquier caso el coeficiente <strong>de</strong> <strong>de</strong>terminación<br />
(R 2 ) es nulo.<br />
V.2. La segunda conclusión que pue<strong>de</strong> extraerse es la notable<br />
diferencia mostrada en el valor <strong>de</strong> la ten<strong>de</strong>ncia en-<br />
1000<br />
800<br />
600<br />
400<br />
200<br />
0<br />
-200<br />
-400<br />
-600<br />
-800<br />
-1000<br />
tre la evolución pluviométrica seguida por el sector septentrional,<br />
provincias <strong>de</strong> Valencia y Castellón y la seguida<br />
por el resto <strong>de</strong>l sector mediterráneo en las provincias<br />
<strong>de</strong> Alicante y Murcia. Así, la ten<strong>de</strong>ncia <strong>de</strong> los sectores septentrionales<br />
no muestra <strong>de</strong>crecimiento <strong>de</strong> las precipitaciones,<br />
con valor <strong>de</strong> 0’06 mm/año, mientras que la ten<strong>de</strong>ncia<br />
<strong>de</strong>l territorio meridional es netamente negativa, con<br />
valor <strong>de</strong> – 0’79 mm/año (Fig. 13).<br />
V.3. Como consecuencia <strong>de</strong> esta evolución tan irregular, y en<br />
la que han bastado dos sequías sobre los años noventa para<br />
marcar una ten<strong>de</strong>ncia negativa, la disminución <strong>de</strong> las lluvias<br />
sobre la región mediterránea es un proceso que no adquiere<br />
significación estadística. Ello queda <strong>de</strong> manifiesto<br />
mediante la aplicación <strong>de</strong> los diversos tests <strong>de</strong> significación.<br />
El test no paramétrico <strong>de</strong> Pettit y el <strong>de</strong> Mann-Kendall, a los<br />
niveles <strong>de</strong> confianza <strong>de</strong>l 95% (Fig. 14) vienen a reflejar que<br />
Pettitt test Mann test<br />
2<br />
1,5<br />
1<br />
0,5<br />
0<br />
-0,5<br />
-1<br />
-1,5<br />
-2<br />
-2,5<br />
-3<br />
1900 1907 1914 1921 1928 1935 1942 1949 1956 1963 1970 1977 1984 1991 1998<br />
1900 1907 1914 1921 1928 1935 1942 1949 1956 1963 1970 1977 1984 1991 1998 2005<br />
Geografia<br />
<strong>de</strong> l’Aigua<br />
FIGURA 12.<br />
Evolución y ten<strong>de</strong>ncia pluviométrica<br />
global <strong>de</strong> las regiones<br />
<strong>de</strong> Valencia y <strong>de</strong> Murcia<br />
(1950-2005). Trend obtenido<br />
tras la homogeneización <strong>de</strong><br />
las 43 series pluviométricas<br />
regionales.<br />
FIGURA 13.<br />
Evolución y ten<strong>de</strong>ncias pluviométricas<br />
<strong>de</strong> la zona norte,<br />
(provincias <strong>de</strong> Valencia y<br />
<strong>de</strong> Castellón) y <strong>de</strong> la zona<br />
sur, (provincias <strong>de</strong> Alicante<br />
y Murcia).<br />
FIGURA 14.<br />
Los test <strong>de</strong> Pettit y Mann-<br />
Kendall, aplicados sobre la<br />
serie media regional <strong>de</strong> las<br />
precipitaciones anuales<br />
muestra que, en el intervalo<br />
<strong>de</strong> confianza <strong>de</strong>l 95%, no<br />
existe significación estadística<br />
<strong>de</strong> ten<strong>de</strong>ncia.<br />
21