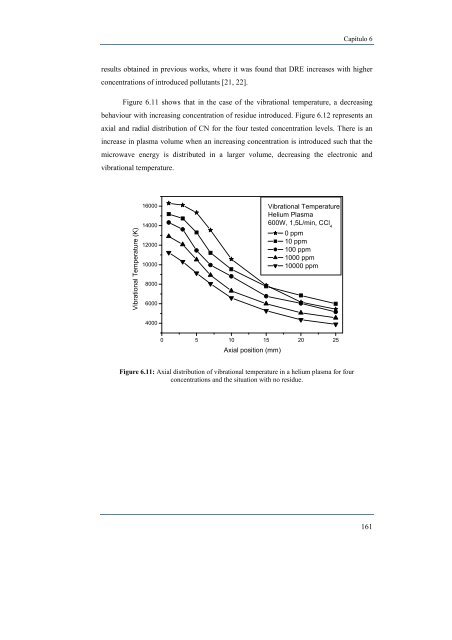
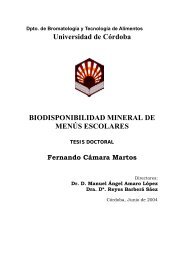
Capítulo 6 results obtained in previous works, where it was fo<strong>un</strong>d that DRE increases with higher concentrations of introduced pollutants [21, 22]. Figure 6.11 shows that in the case of the vibrational temperature, a <strong>de</strong>creasing behaviour with increasing concentration of residue introduced. Figure 6.12 represents an axial and radial distribution of CN for the four tested concentration levels. There is an increase in <strong>plasma</strong> volume when an increasing concentration is introduced such that the microwave energy is distributed in a larger volume, <strong>de</strong>creasing the electronic and vibrational temperature. Vibrational Temperature (K) 16000 Vibrational Temperature Helium Plasma 14000 600W, 1,5L/min, CCl4 0 ppm 10 ppm 12000 100 ppm 1000 ppm 10000 10000 ppm 8000 6000 4000 0 5 10 15 20 25 Axial position (mm) Figure 6.11: Axial distribution of vibrational temperature in a helium <strong>plasma</strong> for four concentrations and the situation with no residue. 161
Distribución <strong>de</strong> temperaturas y especies Axial Position (mm) Axial Position (mm) Figure 6.12: Radial and axial distribution of CN in the helium <strong>plasma</strong> with 600 W and 1.5 L / min for four different concentrations of carbon tetrachlori<strong>de</strong>. 162 35 30 25 20 15 10 5 35 30 25 20 15 10 5 CN 1.5 L/min, 600 W, 1000 ppm CCl 4 CN 1.5 L/min, 600 W, 10 ppm CCl 4 I (a.u.) -1,5 -1,0 -0,5 0,0 0,5 1,0 1,5 Radial Position (mm) I (a.u.) -1,5 -1,0 -0,5 0,0 0,5 1,0 1,5 Radial Position (mm) 0 250,0 500,0 750,0 1000 1250 1500 1750 2000 2250 2500 2750 3000 3250 3500 3750 4000 0 75,00 150,0 225,0 300,0 375,0 450,0 525,0 600,0 675,0 750,0 825,0 900,0 975,0 1050 1125 1200 Axial Position (mm) Axial Position (mm) 35 30 25 20 15 10 5 35 30 25 20 15 10 5 1.5 L/min, 600 W, 100 ppm CCl 4 CN 1.5 L/min, 600 W, 10000 ppm CCl 4 I (a.u.) CN I (a.u.) -1,5 -1,0 -0,5 0,0 0,5 1,0 1,5 Radial Position (mm) -1,5 -1,0 -0,5 0,0 0,5 1,0 1,5 Radial Position (mm) 0 75,00 150,0 225,0 300,0 375,0 450,0 525,0 600,0 675,0 750,0 825,0 900,0 975,0 1050 1125 1200 0 75,00 150,0 225,0 300,0 375,0 450,0 525,0 600,0 675,0 750,0 825,0 900,0 975,0 1050 1125 1200
- Page 1 and 2:
UNIVERSIDAD DE CÓRDOBA FACULTAD DE
- Page 4:
ESTUDIO Y CARACTERIZACIÓN DE UN PL
- Page 8:
Este trabajo ha sido realizado en e
- Page 12:
Dedicado a Rocío, Darío y Noah Un
- Page 15 and 16:
Índice DESTRUCCIÓN DE VOCS CON PL
- Page 17 and 18:
Índice iv 4.4. Ejemplo: Antorcha d
- Page 20 and 21:
ÍNDICE DE FIGURAS Figura I.1: Esqu
- Page 22 and 23:
Índice Figure 3.11: Variation of t
- Page 24:
Índice Figure 6.5: Radial and axia
- Page 28 and 29:
ESTRUCTURA Y OBJETIVOS El presente
- Page 30 and 31:
I.1. Compuestos orgánicos volátil
- Page 32 and 33:
Introducción droguerías. En el si
- Page 34 and 35:
Introducción agua subterránea. Es
- Page 36 and 37:
I.2.1. Técnicas de recuperación d
- Page 38 and 39:
Introducción concentraciones relat
- Page 40 and 41:
Introducción cuando el gas sale de
- Page 42 and 43:
Introducción los gases a algún va
- Page 44 and 45:
Introducción incineradores catalí
- Page 46 and 47:
Introducción En la figura I.3 se m
- Page 48 and 49:
Introducción plasma, y por tanto r
- Page 50 and 51:
I.3.1. Descargas corona pulsadas In
- Page 52 and 53:
Introducción En este caso, la mues
- Page 54 and 55:
Introducción por tanto, las dimens
- Page 56 and 57:
Introducción refiere. De hecho la
- Page 58:
Introducción [26] Hsiao MC, Merrit
- Page 62 and 63:
CAPÍTULO 1 REMOVAL OF VOLATILE ORG
- Page 64 and 65:
1.2. Experimental set-up Capítulo
- Page 66 and 67:
Capítulo 1 The destruction percent
- Page 68 and 69:
Capítulo 1 Our data also support t
- Page 70 and 71:
% DRE % DRE 100,0000 100,0000 99,99
- Page 72 and 73:
Capítulo 1 Energy efficiencies of
- Page 74 and 75:
CAPÍTULO 2 APPLICATION OF A MICROW
- Page 76 and 77:
Capítulo 2 at atmospheric pressure
- Page 78 and 79:
2.2.1. Microwave generator and coup
- Page 80 and 81:
2.3. Results 2.3.1. Destruction of
- Page 82 and 83:
Capítulo 2 mm. The curves are simi
- Page 84 and 85:
Capítulo 2 In obtaining high energ
- Page 86 and 87:
Capítulo 2 Figure 2.6b shows the v
- Page 88 and 89:
Capítulo 2 revealed the presence o
- Page 90 and 91:
Capítulo 2 destruction step but un
- Page 92 and 93:
Capítulo 2 concentrations in the p
- Page 94:
[23] B.M. Penetrante, et al.: Plasm
- Page 98 and 99:
CAPÍTULO 3 ASSESSMENT OF A NEW CAR
- Page 100 and 101:
Capítulo 3 enhanced destruction an
- Page 102 and 103:
3.2.1. Microwave generator and its
- Page 104 and 105:
3.2.2. Sample insertion Capítulo 3
- Page 106 and 107:
Capítulo 3 concentration was a res
- Page 108 and 109:
Capítulo 3 Figure 3.4: Variation o
- Page 110 and 111:
Capítulo 3 different microwave pow
- Page 112 and 113:
Concentration CO 2 (ppm) 10000 1000
- Page 114 and 115:
Capítulo 3 CuCl2·2H2O on glass su
- Page 116 and 117:
Capítulo 3 Figure 3.10 shows some
- Page 118 and 119:
3.4. Conclusions Capítulo 3 The pr
- Page 120:
Capítulo 3 [14] A. Rodero, M.C. Qu
- Page 123 and 124:
Destrucción de VOCs con plasma de
- Page 125 and 126:
Destrucción de VOCs con plasma de
- Page 127 and 128:
Destrucción de VOCs con plasma de
- Page 129 and 130:
Destrucción de VOCs con plasma de
- Page 131 and 132:
Destrucción de VOCs con plasma de
- Page 133 and 134:
Destrucción de VOCs con plasma de
- Page 135 and 136:
Destrucción de VOCs con plasma de
- Page 137 and 138: Destrucción de VOCs con plasma de
- Page 139 and 140: Destrucción de VOCs con plasma de
- Page 141 and 142: Destrucción de VOCs con plasma de
- Page 143 and 144: Destrucción de VOCs con plasma de
- Page 145 and 146: Destrucción de VOCs con plasma de
- Page 148 and 149: CAPÍTULO 5 APPLICATION OF MICROWAV
- Page 150 and 151: Capítulo 5 99% were achieved. Usin
- Page 152 and 153: COMPONENT DESCRIPTION Microwave gen
- Page 154 and 155: Concentration (ppb) 300 250 200 150
- Page 156 and 157: TCC Concentration (ppb) 1100 1000 9
- Page 158 and 159: Capítulo 5 5.4 and 5.5 are virtual
- Page 160 and 161: Capítulo 5 indicated that the syst
- Page 162 and 163: Capítulo 5 was nearly 100%. The de
- Page 164 and 165: Capítulo 5 GC/MS analyses revealed
- Page 166 and 167: Figure 5.12: CN rotational bands ob
- Page 168 and 169: 5.5. References [1] R.E. Doherty: J
- Page 170: DISTRIBUCIÓN DE TEMPERATURAS Y ESP
- Page 173 and 174: Distribución de temperaturas y esp
- Page 175 and 176: Distribución de temperaturas y esp
- Page 177 and 178: Distribución de temperaturas y esp
- Page 179 and 180: Distribución de temperaturas y esp
- Page 181 and 182: Distribución de temperaturas y esp
- Page 183 and 184: Distribución de temperaturas y esp
- Page 185 and 186: Distribución de temperaturas y esp
- Page 187: Distribución de temperaturas y esp
- Page 191 and 192: Distribución de temperaturas y esp
- Page 194 and 195: CAPÍTULO 7 AXIAL DISTRIBUTION OF T
- Page 196 and 197: Capítulo 7 of C2HCl3 achieve destr
- Page 198 and 199: 7.3. Results Capítulo 7 To study t
- Page 200: 7.4. References [1] N.J. Park Ridge
- Page 203 and 204: Distribución de temperaturas y esp
- Page 205 and 206: Axial position (mm) Axial Position
- Page 208 and 209: CONCLUSIONES GENERALES • Ha sido
- Page 210 and 211: Conclusiones Generales punta del ac
- Page 212 and 213: ANEXO Producción científica fruto
- Page 214 and 215: Producción científica fruto de es