estudio y caracterización de un plasma de microondas a presión ...
estudio y caracterización de un plasma de microondas a presión ...
estudio y caracterización de un plasma de microondas a presión ...

You also want an ePaper? Increase the reach of your titles
YUMPU automatically turns print PDFs into web optimized ePapers that Google loves.
Destrucción <strong>de</strong> VOCs con <strong>plasma</strong> <strong>de</strong> Helio<br />
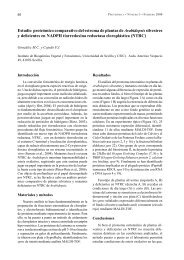
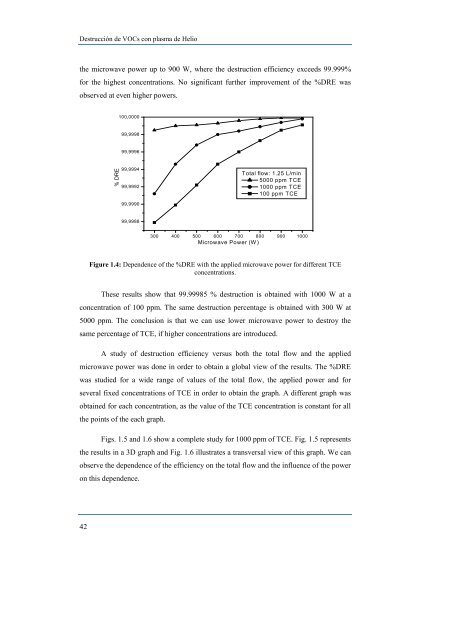
the microwave power up to 900 W, where the <strong>de</strong>struction efficiency exceeds 99.999%<br />
for the highest concentrations. No significant further improvement of the %DRE was<br />
observed at even higher powers.<br />
42<br />
% DRE<br />
100,0000<br />
99,9998<br />
99,9996<br />
99,9994<br />
99,9992<br />
99,9990<br />
99,9988<br />
Figure 1.4: Depen<strong>de</strong>nce of the %DRE with the applied microwave power for different TCE<br />
concentrations.<br />
These results show that 99.99985 % <strong>de</strong>struction is obtained with 1000 W at a<br />
concentration of 100 ppm. The same <strong>de</strong>struction percentage is obtained with 300 W at<br />
5000 ppm. The conclusion is that we can use lower microwave power to <strong>de</strong>stroy the<br />
same percentage of TCE, if higher concentrations are introduced.<br />
A study of <strong>de</strong>struction efficiency versus both the total flow and the applied<br />
microwave power was done in or<strong>de</strong>r to obtain a global view of the results. The %DRE<br />
was studied for a wi<strong>de</strong> range of values of the total flow, the applied power and for<br />
several fixed concentrations of TCE in or<strong>de</strong>r to obtain the graph. A different graph was<br />
obtained for each concentration, as the value of the TCE concentration is constant for all<br />
the points of the each graph.<br />
Figs. 1.5 and 1.6 show a complete study for 1000 ppm of TCE. Fig. 1.5 represents<br />
the results in a 3D graph and Fig. 1.6 illustrates a transversal view of this graph. We can<br />
observe the <strong>de</strong>pen<strong>de</strong>nce of the efficiency on the total flow and the influence of the power<br />
on this <strong>de</strong>pen<strong>de</strong>nce.<br />
Total flow: 1.25 L/m in<br />
5000 ppm TCE<br />
1000 ppm TCE<br />
100 ppm TCE<br />
300 400 500 600 700 800 900 1000<br />
Microwave Power (W )